
Kubernetes failures rarely look dramatic at first.
A deployment succeeds, pods appear to be running, and then production traffic slowly starts failing.
Some containers restart repeatedly. New pods stay stuck in Pending. Logs show nothing useful. The actual issue is often a small configuration mistake somewhere in the cluster.
These situations are common in production environments. The difficult part is not always fixing the problem it is knowing where to look first.
This article covers some of the most common Kubernetes production issues, why they happen, and the kubectl commands that help identify them quickly.
When your cluster is burning, you need answers fast. Read the following quick cheat sheet for the most common Kubernetes pod errors.
| Error | What It Means | First Command to Run |
|---|---|---|
| CrashLoopBackOff | Container crashes immediately on startup and keeps restarting | kubectl logs <pod> --previous |
| ImagePullBackOff | Node cannot download the container image from the registry | kubectl describe pod <pod> |
| OOMKilled (Exit Code 137) | App exceeded memory limit Linux killed the process | kubectl top pods |
| Pending | Scheduler cannot find a node to place the pod on | kubectl describe pod <pod> |
| NodeNotReady | Worker node crashed or lost contact with the control plane | kubectl describe node <node> |
| CreateContainerConfigError | Pod references a Secret or ConfigMap that does not exist | kubectl describe pod <pod> |
| ErrImagePull | First image pull attempt failed | kubectl describe pod <pod> |
| Readiness Probe Failed | App not ready to receive traffic removed from load balancer | kubectl describe pod <pod> |
| Liveness Probe Failed | Heartbeat check failed Kubernetes forcefully restarted pod | kubectl get pods (watch restart count) |
| PodInitializing | initContainer script is stuck or failing | kubectl logs <pod> -c <init-container-name> |
Kubernetes Troubleshooting Workflow
Before looking at specific Kubernetes errors, a game plan is needed. Guessing wastes time during an outage. A real engineer debugs systematically using a core set of Kubernetes troubleshooting commands.
Here is the step-by-step workflow to memorize:
kubectl get pods Always start here. This gives a bird's-eye view. Look at the Status column and the Restart count. If a pod has restarted 50 times, that is where the problem is. |
kubectl describe pod <pod-name> If a pod is failing, this is the best friend. Scroll to the Events section at the bottom. This is where Kubernetes explains exactly what the cluster is thinking for example, "I cannot schedule this because there is no CPU left." |
kubectl logs <pod-name> This pulls the application's standard output. Use this to read stack traces and find bugs in the code. |
kubectl logs <pod-name> --previous If the container keeps crashing instantly, live logs will be empty. The --previous flag pulls the logs from the dead container instance so you can see its dying words. |
kubectl get events This shows a timeline of everything happening in the cluster. It helps connect the dots like noticing a node ran out of memory five seconds before a pod got kicked out. |
kubectl top pods This shows real-time CPU and memory usage. It is the fastest way to spot an application that is leaking memory. |
Common Kubernetes Errors You’ll See in Production
Most Kubernetes production issues follow a few common patterns. Containers may crash during startup, pods can remain stuck in a Pending state, or health checks may fail because of configuration or resource problems.
Kubernetes usually provides useful error signals through events, logs, and pod status messages. Once you know where to look, troubleshooting becomes much faster and more structured.
The following sections cover the most common Kubernetes errors engineers face in production, along with the exact kubectl commands and YAML fixes used to resolve them quickly.
What is CrashLoopBackOff and how to fix it?
What it means:
A CrashLoopBackOff means the container is starting, crashing immediately, and Kubernetes is trying to restart it. To save CPU, Kubernetes waits longer and longer between each restart attempt, this is the "backoff."
Common Causes:
- The application code threw a fatal error right on boot.
- The startup command (entrypoint) in the Dockerfile is wrong.
- The pod is missing a mandatory environment variable.
- The app tries to connect to a database that is not ready, so it panics and dies.
How to Debug It:
First, check the events to make sure it is an app crash and not a cluster eviction.
| kubectl describe pod <pod-name> |
Next, grab the logs from the container that just died. This is the most important step.
| kubectl logs <pod-name> --previous |
If the logs say "Connection refused to database" or "Missing API_KEY," the culprit has been found.
A More Reliable Approach:
In some environments, an initContainer can delay application startup until the database becomes reachable. However, production-grade applications should still implement retry logic rather than assuming dependencies are always immediately available.
| apiVersion: v1 kind: Pod metadata: name: my-backend spec: initContainers: - name: wait-for-db image: busybox command: ['sh', '-c', 'until nc -z my-database 5432; do echo waiting for db; sleep 2; done;'] containers: - name: main-app image: my-backend-app:v1 |
Prevention Tips:
Write resilient application code. The app should gracefully retry a broken database connection instead of crashing the entire process. Also, validate configuration files in the CI/CD pipeline before they ever reach production.
What is ImagePullBackOff and how to fix it?
What it means:
The worker node physically cannot download the container image from the registry. The cluster tries to pull it, fails, and backs off.
Common Causes:
- A typo was made in the image name or version tag.
- The image tag was deleted from the registry.
- The pod is pulling from a private registry but does not have login credentials.
- The public Docker Hub rate limit was hit.
How to Debug It:
Check the pod events:
| kubectl describe pod <pod-name> |
A clear error will appear saying "pull access denied" or "manifest not found."
A More Reliable Approach:
Check the YAML for typos. If the spelling is correct, credentials are likely missing. Create a Secret with registry login and attach it to the pod.
| kubectl create secret docker-registry my-registry-key \ --docker-server=private-registry.com \ --docker-username=admin \ --docker-password="$REGISTRY_PASSWORD" |
Then add imagePullSecrets to the pod YAML:
| apiVersion: v1 kind: Pod metadata: name: secured-app spec: containers: - name: app image: private-registry.com/app:v1 imagePullSecrets: - name: my-registry-key |
Prevention Tips:
Never use the :latest tag. Always deploy specific versions (like :v1.2.4). Set up a private proxy registry inside the network to avoid public Docker Hub rate limits.
What is OOMKilled and how to fix it?
What it means:
OOM stands for Out-Of-Memory. The Linux kernel forcefully killed the container because it tried to use more RAM than its Kubernetes limit allowed. This appears as Exit Code 137.
Common Causes:
- The memory limits were set too low in the YAML file.
- The application has a memory leak and slowly eats up RAM over several days.
- Older JVM versions or misconfigured JVM settings may ignore container memory boundaries and attempt to consume excessive host memory.
How to Debug It:
First, verify it was an OOM kill by checking the termination reason and exit code:
| kubectl get pod <pod-name> -o jsonpath='{.status.containerStatuses[*].lastState.terminated.{reason,exitCode}}' |
Then check how much memory other pods are actively using to see if a leak is happening cluster-wide:
| kubectl top pods |
A More Reliable Approach:
If the app actually needs the RAM to do its job, increase the memory limits in the deployment YAML. For modern Java runtimes, combine it with -XX:+UseContainerSupport (usually the default) and consider -XX:MaxRAMPercentage=70.0 to leave headroom for the container runtime.
| apiVersion: v1 kind: Pod metadata: name: heavy-worker spec: containers: - name: worker image: data-processor:v1 resources: requests: memory: "1Gi" limits: memory: "1Gi" |
| Platform Tip: Setting memory requests equal to limits assigns the pod a Guaranteed Quality of Service (QoS) class. This prevents Kubernetes from evicting the pod when the underlying worker node experiences memory pressure. |
Prevention Tips:
Use Kubernetes Horizontal Pod Autoscaling (HPA). If an app starts getting crushed by heavy traffic, the HPA will automatically spin up more pods to share the load before any single pod runs out of memory.
What is a Pending Pod and how to fix it?
What it means:
A pod in the Pending state has been accepted by Kubernetes, but the scheduler cannot figure out where to put it. It is physically homeless.
Common Causes:
- There is not enough total CPU or Memory left in the cluster to fit the pod.
- A Persistent Volume Claim (PVC) was requested for storage, but the cloud provider failed to create the disk.
- Strict node selectors were used (e.g., "only run on GPU nodes"), but all those nodes are full.
- The nodes have taints (rules blocking pods), and the pod lacks the right toleration to bypass them.
How to Debug It:
The scheduler writes exact rejection reasons directly into the events:
| kubectl describe pod <pod-name> |
A message will appear like: "FailedScheduling: 0/10 nodes are available: 3 Insufficient cpu, 7 node(s) had taint {dedicated: gpu}, that the pod did not tolerate."
A More Reliable Approach:
Either add more worker nodes to the cluster, or lower the requests in the pod YAML so it can fit into an available space. If it is a taint issue, add the matching toleration:
| apiVersion: v1 kind: Pod metadata: name: gpu-worker spec: tolerations: - key: "dedicated" operator: "Equal" value: "database" effect: "NoSchedule" containers: - name: app image: db-app:v1 |
Prevention Tips:
Enable the Cluster Autoscaler. If a pod goes into a Pending state because of low resources, the autoscaler will automatically talk to AWS, GCP, or Azure and provision a new virtual machine to handle the load.
What is NodeNotReady and how to fix it?
What it means:
This is an infrastructure problem. The underlying server (worker node) has crashed or stopped talking to the Kubernetes control plane. Kubernetes may begin marking pods for eviction and rescheduling depending on controller timing and workload configuration.
Common Causes:
- The hard drive on the Linux server is 100% full (Disk Pressure).
- The kubelet agent running on the node crashed.
- A network firewall rule was changed, blocking communication.
How to Debug It:
Stop looking at the pods. Check the nodes instead:
| kubectl get nodes kubectl describe node <node-name> |
Look for the KubeletHasDiskPressure warning in the Conditions section.
A More Reliable Approach:
Because the node is disconnected, kubectl commands will not help much. SSH directly into the broken Linux server.
First, check the kubelet service:
| journalctl -u kubelet |
If the hard drive is full, clear old system logs immediately:
| sudo journalctl --vacuum-time=3d |
More commonly, the disk is full of unused container images. Prune them using the container runtime CLI:
| sudo crictl rmi --prune |
Prevention Tips:
Never let containers log to the local disk forever. Set up strict log rotation on host operating systems, and use a tool like Fluentd to ship logs to a central database.
What is CreateContainerConfigError and how to fix it?
What it means:
Kubernetes found a server for the pod, but the local agent (kubelet) refuses to build the container. The pod is asking for a configuration file that does not exist.
Common Causes:
- The YAML file points to a Secret that was never created.
- The YAML file asks for a ConfigMap, but the name was misspelled.
- The spec is trying to load a specific key from a Secret, but that key is missing.
How to Debug It:
| kubectl describe pod <pod-name> |
The event log will be very specific. It will say exactly what is missing, like: configmap "database-config" not found.
A More Reliable Approach:
Create the missing configuration object in the exact same namespace:
| kubectl apply -f my-missing-configmap.yaml |
Once the ConfigMap is created, Kubernetes will automatically detect it, build the container, and start the pod.
Prevention Tips:
Stop deploying files manually one by one. Use a packaging tool like Helm or Kustomize. These tools bundle the app, ConfigMaps, and Secrets into a single deployment, ensuring no dependencies are left behind.
What is ErrImagePull and how to fix it?
What it means:
ErrImagePull is the first failure when Kubernetes tries to pull a container image. If it keeps failing, it transitions into ImagePullBackOff.
How to Debug and Fix It:
The debugging and fix steps are identical to ImagePullBackOff. Check the spelling, verify registry access, and use crictl pull <image-name> on the node for deeper network diagnosis. For critical production apps, mirror container images to an internal registry so an external internet outage does not break deployments.
What is Readiness Probe Failed and how to fix it?
What it means:
A Readiness Probe is a network health check. It asks: "Is this app ready to take user traffic?" If the probe fails, Kubernetes does not kill the pod. Instead, it unplugs it from the load balancer. Users will not be sent to this pod until the probe passes.
Common Causes:
- A Java or Node.js app takes 45 seconds to boot up, but the probe starts checking after 5 seconds and assumes it is broken.
- The /health endpoint is throwing a 500 internal server error.
- No readiness probe was configured, so Kubernetes sends traffic to the pod the millisecond it starts, resulting in dropped connections.
How to Debug It:
Check the exact HTTP status code the probe is receiving:
| kubectl describe pod <pod-name> |
A More Reliable Approach:
If the application is simply slow to warm up its caches, do not hardcode a massive initialDelaySeconds. Instead, configure a startupProbe. A startup probe gives the app a grace period to boot. Once it passes, the readiness probe takes over for standard traffic routing.
| startupProbe: httpGet: path: /ready port: 8080 failureThreshold: 15 periodSeconds: 3 readinessProbe: httpGet: path: /ready port: 8080 periodSeconds: 10 |
Prevention Tips:
A readiness probe should accurately check if the app can handle a request. Do not return a 200 OK status if the core background threads are still starting up.
What is Liveness Probe Failed and how to fix it?
What it means:
A Liveness Probe is a heartbeat check. It asks: "Is this app totally frozen or deadlocked?" If a liveness probe fails repeatedly, Kubernetes restarts the pod from scratch.
Common Causes:
- The health check is too aggressive, failing just because the CPU is momentarily busy.
- The liveness probe is checking an external database this is the ultimate anti-pattern.
How to Debug It:
Run kubectl get pods and watch the restart count. If the restarts happen on a perfect, rhythmic schedule, the liveness probe is definitely killing the app.
A More Reliable Approach:
If the liveness probe checks a database, and the database drops offline for five seconds, every single pod's liveness probe will fail. Kubernetes will restart the entire fleet of apps at the exact same time.
Fix this by removing external dependencies from liveness probes. The probe should strictly check if the local web server thread is alive:
| livenessProbe: httpGet: path: /ping port: 8080 timeoutSeconds: 3 failureThreshold: 3 |
Prevention Tips:
Keep liveness probes incredibly simple. If there is a legacy application that takes three minutes to start, use a startupProbe to pause the liveness check until the boot sequence is completely finished.
What is PodInitializing and how to fix it?
What it means:
The pod is permanently stuck in the setup phase. Kubernetes uses initContainers to run setup scripts before the main app boots. If an initContainer fails, the whole pod stops moving.
Common Causes:
- A bash script inside the init container has an infinite loop.
- The init container is trying to run a database schema migration, but the database is locked.
- The script is trying to curl an external file, but the network is blocking it.
How to Debug It:
If kubectl logs is run, it tries to pull logs from the main app, which has not started yet. The init container must be specified explicitly:
| kubectl logs <pod-name> -c <init-container-name> |
A More Reliable Approach:
Read the logs from the command above to find exactly where the script froze. Fix the script logic, or fix the network route the script is trying to use.
Prevention Tips:
Never write a bash script in an initContainer without a strict timeout. If a script hangs forever, the pod will be stuck in PodInitializing forever, blocking the entire release pipeline.
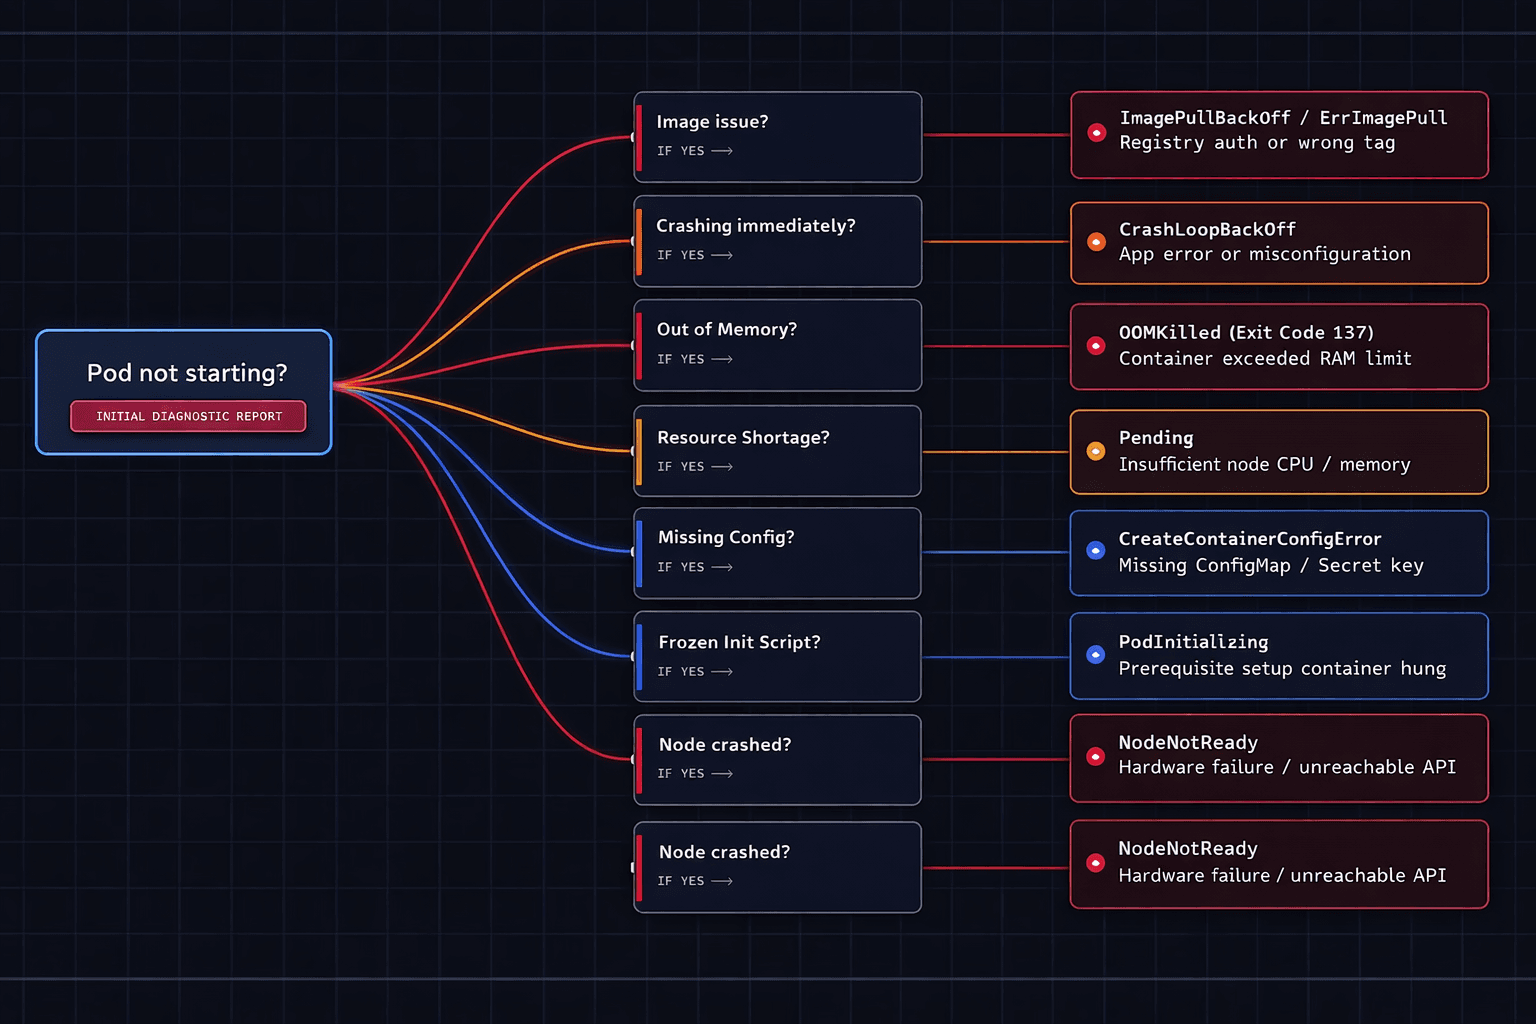
Visualizing the Troubleshooting Workflow
When production is down, a mental map is needed. Here is how a senior engineer navigates pod lifecycle errors:
Kubernetes Best Practices to Avoid Production Errors
Great platform teams do not just fix errors they stop them from happening in the first place. Adopting a proactive mindset keeps on-call engineers sleeping through the night.
| Best Practice | Why It Matters |
|---|---|
| Enforce Requests and Limits | Never let a developer deploy a pod without CPU and memory boundaries. Missing resource boundaries lead to noisy-neighbour problems, node instability, and unpredictable OOM behavior. |
| Write Smart Probes | Always configure readiness probes to protect user traffic and liveness probes to catch deadlocks. Never let a liveness probe fail due to a third-party API outage. |
| Use Centralized Logging | Container logs disappear the second a pod dies or gets evicted. Use tools like Fluent Bit or Datadog to ship all logs to a central server so historical crashes are always debuggable. |
| Adopt GitOps | Stop running kubectl edit in production. Manage all YAML in Git using ArgoCD or Flux. This guarantees the production environment matches the code exactly. |
| Lock Down RBAC | Use strict Role-Based Access Control so a tired engineer cannot accidentally delete the production database secret. |
| Monitor and Alert Proactively | Do not wait for users to complain. Set up Prometheus to alert when a pod hits 85% of its memory limit, allowing a fix before the OOM killer strikes. |
Frequently Asked Questions (FAQs)
Why do Kubernetes pods keep restarting?
Pods usually restart in a CrashLoopBackOff because the application inside is crashing due to a fatal bug, missing configuration files, or a liveness probe that mistakenly thinks the app is dead and forces a reboot.
What causes OOMKilled?
OOMKilled (Exit Code 137) means the application tried to use more RAM than the strict limit set in the YAML manifest. Linux kills the process to prevent the server from running out of memory.
How do I debug Pending pods?
Run kubectl describe pod <pod-name> and scroll to the Events section. Kubernetes will explain exactly why it cannot place the pod usually because there is not enough CPU or memory left on the worker nodes.
What is the difference between ErrImagePull and ImagePullBackOff?
ErrImagePull is the very first time the cluster fails to download a container image. When it keeps failing and retrying, the delay between attempts increases, which puts the pod into the ImagePullBackOff state.
How do I troubleshoot Kubernetes faster?
Stop guessing and start following a strict workflow. Use kubectl get pods for an overview, kubectl describe pod to read cluster events, and kubectl logs --previous to see why a container crashed. Ship all logs to a central database so they are never lost when a pod dies.

