
A CrashLoopBackOff alert triggers, and a quick inspection of the workload reveals the reason: OOMKilled. In many cases, engineers note that they recently increased memory limits, and observability tools often show utilization hovering at safe levels just moments before the crash. When the metrics do not align with the failure, simply doubling the limits again is a guess rather than a systematic fix.
The exit code indicates what occurred. This article explains why.
To prevent recurrent container terminations, it is necessary to look past Kubernetes abstractions and examine how memory boundaries are actively enforced at the infrastructure layer. Part 1 of this series covers how the Linux kernel, control groups (cgroups), and node-level pressure dictate these terminations. Subsequent posts in Parts 2 and 3 will explore eBPF-driven observability, language-specific runtime complexities (such as those in the JVM and Go), and long-term architectural prevention strategies.
1. What OOMKilled Actually Means
When a container status shows OOMKilled, Kubernetes itself did not terminate the workload. The action is executed by the Linux kernel’s Out-Of-Memory (OOM) Killer.
When a process attempts to allocate memory that is unavailable, the kernel intervenes to protect system stability. It selects a target based on an internal scoring algorithm and sends it a SIGKILL (Signal 9). Because the process exits with signal 9, the container runtime records an exit code of 137 (calculated as 128 + 9).
To diagnose the root cause efficiently, engineers must first distinguish between two distinct scenarios:
- Container-Level OOM: The specific container attempted to consume more memory than its isolated boundary allowed. The node itself might have ample available RAM, but the container crossed its assigned hard limit, prompting the kernel to terminate the process to enforce that specific boundary.
- Node-Level OOM: The entire Kubernetes worker node is experiencing severe memory exhaustion. When system memory reaches a critical threshold, the kernel begins terminating processes to keep the operating system functional. In this scenario, a pod might be operating well within its individual limit but is still terminated to relieve node-level pressure.
This distinction explains why kubectl describe pod often provides an incomplete picture. It will display Reason: OOMKilled for the pod's last state, but it will not specify whether it was an isolated container breach or a systemic node issue. Identifying a node-level event requires querying kubectl describe node or reviewing kernel logs for SystemOOM events.
Quick Reference for Triage:
- Exit Code 137 + OOMKilled reason: The process received a SIGKILL.
- Pod Events: Look for Memory cgroup out of memory (indicates a Container OOM).
- Node Events: Look for SystemOOM or NodeHasMemoryPressure (indicates a Node OOM).
2. The cgroup Boundary: How Kubernetes Enforces Memory Limits
Kubernetes does not natively possess the capability to throttle or isolate memory. Instead, it relies entirely on a Linux kernel feature called control groups (cgroups).
A cgroup functions as an accounting and enforcement mechanism. When the kubelet initializes a container, it creates a cgroup hierarchy for that pod and assigns the container's processes to it. The kernel then continuously tracks the memory pages mapped by those specific processes.
When a deployment is configured with resources.limits.memory: "2Gi", the kubelet translates that YAML directive into a hard kernel constraint. In modern environments utilizing cgroup v2, this sets the memory.max parameter for the container's cgroup. If the processes inside that cgroup attempt an allocation that exceeds this threshold, the kernel immediately pauses the task and invokes the OOM killer restricted to that specific cgroup.
Understanding the sequence of terminations requires distinguishing between requests and limits. (This distinction is foundational and will govern the troubleshooting steps discussed later in this series):
- Requests inform the scheduler. This is the baseline amount of memory the node must guarantee is available to accept the pod.
- Limits inform the cgroup. This is the hard ceiling at which the kernel will terminate the process.
Kubernetes leverages these two values to assign a pod's Quality of Service (QoS) class, which directly manipulates the Linux oom_score_adj (OOM Score Adjustment). When a Node-Level OOM occurs, the kernel relies on these scores to determine the eviction order:
- BestEffort (Highest Eviction Priority): Pods configured with no memory requests or limits. They are assigned an oom_score_adj of 1000 and are the first to be terminated under system pressure.
- Burstable (Variable Priority): Pods where requests are lower than limits. Their score is calculated dynamically based on their current memory utilization relative to their request. Sudden spikes make them active targets.
- Guaranteed (Lowest Eviction Priority): Pods where requests equal limits. They receive an oom_score_adj of -997. The kernel will terminate almost all other eligible processes on the system before impacting these workloads.
In summary, setting a limit establishes the cgroup boundary, while setting the request dictates the pod's survival priority when that boundary or the node's capacity is compromised.
3. Why "Available Memory" Is Lying to You
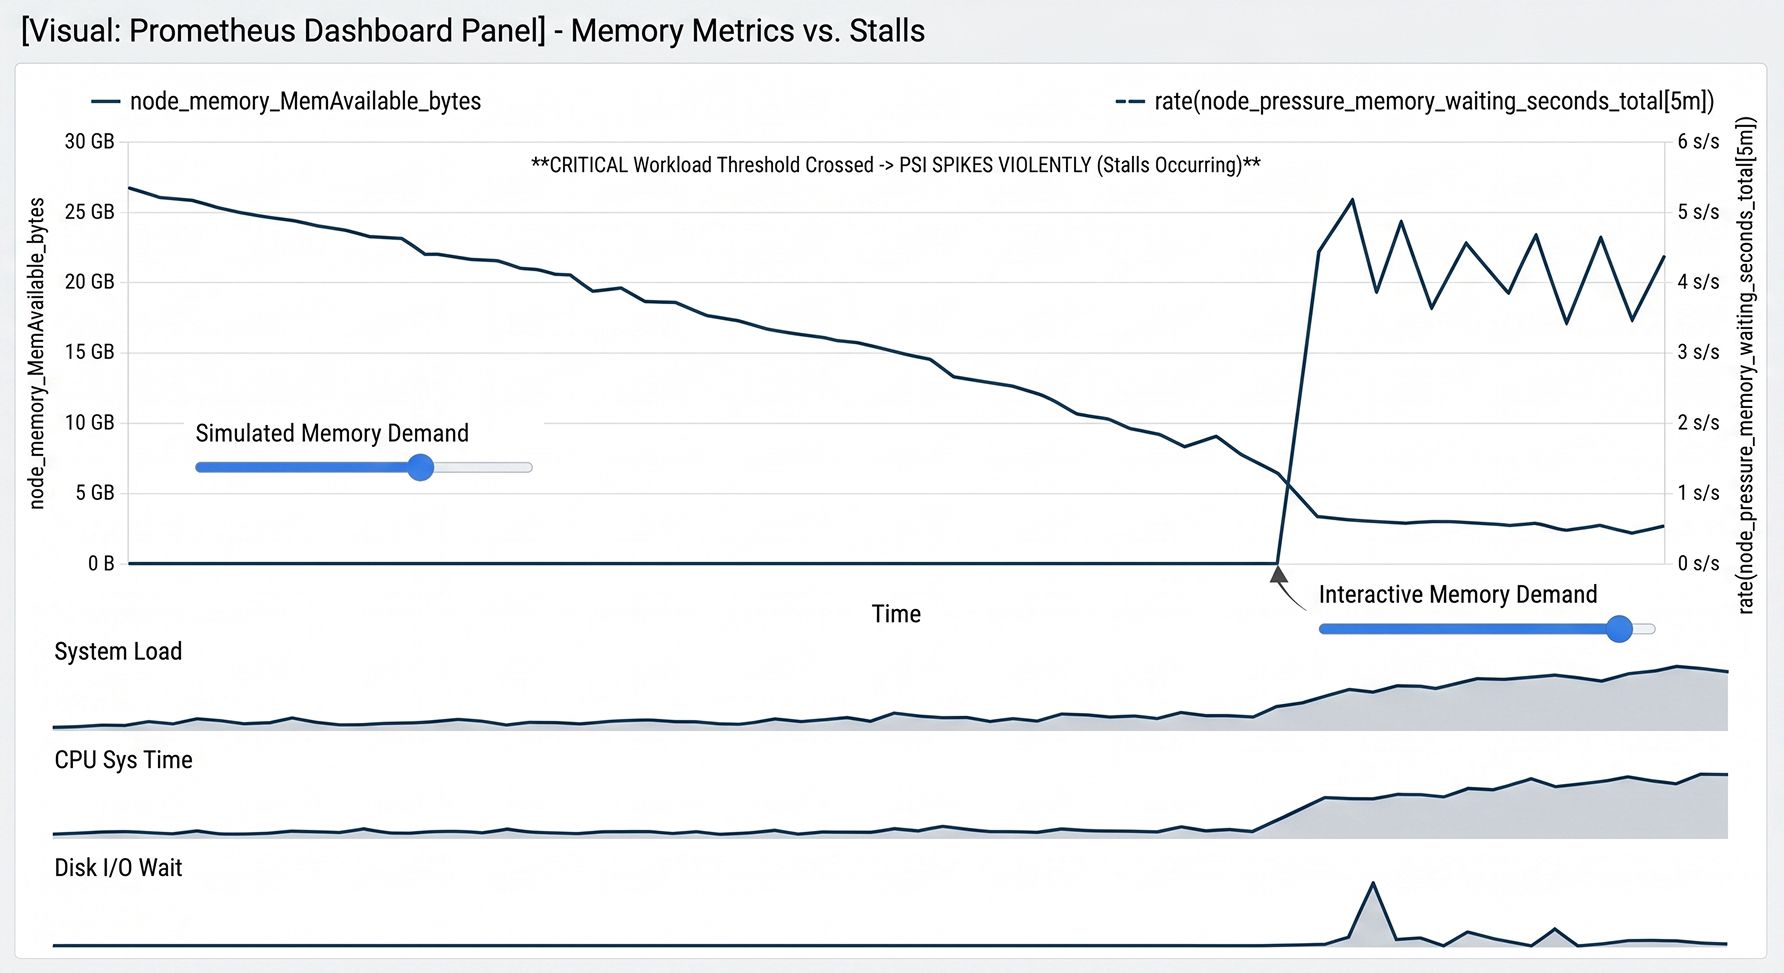 Figure 1: Prometheus Dashboard Visualization: MemAvailable decline is harmless until a critical memory stall threshold is met, triggering a violent spike in Pressure Stall Information (PSI) and system-level stalls.
During a memory-related incident, engineers routinely check kubectl top nodes or Prometheus dashboards tracking node_memory_MemAvailable_bytes. However, relying on these traditional metrics can lead to deeply flawed conclusions about cluster health.
MemAvailable provides an estimate of the memory that can be allocated to new processes without pushing the system into swapping. It is not a measurement of raw "free" memory. The discrepancy largely comes down to the Linux page cache.
The kernel is designed to utilize unused RAM to cache file system I/O, speeding up subsequent read and write operations. While the kernel considers this page cache memory to be "reclaimable," heavy data processing or logging workloads can inflate it rapidly. This becomes particularly critical in modern Kubernetes environments running cgroup v2. Under cgroup v2, page cache usage is accounted for within a container's memory boundary much more strictly than in v1. A container writing large temporary files might trigger a cgroup limit breach purely due to page cache accumulation, even if the application's actual heap usage remains exceptionally low.
Because "available" memory fluctuates constantly with cache allocation and reclamation, observing a drop in this metric does not necessarily indicate a problem. To determine if a node is actually struggling, modern observability relies on Pressure Stall Information (PSI).
Introduced in newer Linux kernels, PSI measures the exact percentage of wall-clock time that tasks are delayed because they are waiting for hardware resources. Instead of guessing based on memory availability, SREs should monitor node_pressure_memory_waiting_seconds_total (often viewed as a rate() query in PromQL).
If memory appears low but PSI remains near zero, the kernel is efficiently reclaiming page cache the system is healthy. If the PSI rate spikes, processes are actively stalling while the kernel scrambles to free memory pages.
4. Memory Thrashing vs OOM, Two Different Problems
A common pitfall in post-mortem analysis is treating an OOMKilled event as an isolated, instantaneous failure. In reality, a kernel-initiated kill is usually the final, drastic act following a period of severe degradation known as memory thrashing.
Thrashing occurs when the system spends a disproportionate amount of time and CPU cycles attempting to reclaim memory such as scanning for pages to evict, flushing page cache to disk, or swapping (in environments where swap is enabled) rather than executing application code. During this phase, the system is actively starving, but it has not yet terminated any processes. The OOM killer is only invoked when the kernel's kswapd daemon exhausts all reclamation options and memory allocation requests can no longer be fulfilled.
Treating thrashing and an OOM kill as the same problem leads to ineffective remediation. If a pod is terminated due to an internal application memory leak, the solution involves profiling the code; blindly increasing memory limits only delays the inevitable crash. Conversely, if a pod is terminated because the node itself was thrashing due to a noisy neighbor's aggressive disk I/O, altering the victim pod's memory limits accomplishes nothing. The root cause was systemic node pressure, not a container-level boundary breach.
To prevent OOMKilled events, monitoring must be calibrated to catch thrashing before the kernel resorts to a SIGKILL. The early warning signs are distinct:
- Sustained spikes in node CPU usage, specifically in System/sys time, indicating high kernel overhead.
- Unexplained increases in application latency or dropped network connections without corresponding CPU saturation in user space.
- A climbing PSI memory wait time, as established in the previous section.
5. Your First-Response Diagnostic Checklist
When the 2 AM alert fires, guessing is not an option. You need to determine immediately whether you are dealing with a localized application breach or a cascading node failure. Execute this 5-step triage flow:
Step 1: Pod-Level Confirmation Verify the exit code and termination reason. Do not rely solely on the current state; inspect the lastState.
| Bash kubectl get pod <pod-name> -n <namespace> \ -o jsonpath='{.status.containerStatuses[*].lastState.terminated.reason}' |
Look for: OOMKilled. If the exit code is 137, a SIGKILL was issued.
Step 2: Namespace Blast Radius Determine if this is an isolated incident or a wider deployment issue.
| Bash kubectl get pods -n <namespace> | grep -i CrashLoopBackOff |
Look for: Multiple pods failing simultaneously, which often points to a bad deployment or widespread node pressure.
Step 3: Node-Level Health Identify the node hosting the failed pod and check for systemic memory exhaustion.
| Bash kubectl get events --field-selector involvedObject.kind=Node \ --field-selector involvedObject.name=<node-name> |
Look for: SystemOOM or NodeHasMemoryPressure. If these are present, your pod was likely a victim of its QoS class, not its own memory leak.
Step 4: Pressure Verification If you have node access or a centralized logging stack, check the kernel logs to see exactly what the OOM killer did.
| Bash dmesg -T | grep -i -E 'oom-kill|killed process' |
Look for: Memory cgroup out of memory (Container OOM) vs. Out of memory: Killed process (Node OOM).
Step 5: Application Handoff Once you've confirmed the kill and ruled out node pressure, the next question is your application's memory behavior covered in Part 2.
Conclusion
The most critical takeaway for operating Kubernetes reliably is separating orchestration from infrastructure. Kubernetes does not kill containers; the Linux kernel does. The orchestrator merely translates your YAML into cgroup boundaries and QoS scoring. From there, system physics take over: the kernel enforces limits, page cache dictates actual availability, pressure builds, and eventually, the OOM killer executes its mandate to protect the node.
Understanding these mechanics stops the cycle of blindly increasing limits. In Part 2, we will move past the infrastructure layer and into the application itself, utilizing eBPF for deep memory observability and uncovering the language-specific runtime traps that cause modern applications to silently leak memory.

