Deploying a container on Kubernetes is easy. Running a stable, highly available system in production is the hard part.
Kubernetes abstracts infrastructure powerfully, but that abstraction often hides problems that only surface under real production load. A manifest that passes CI/CD and runs cleanly in staging can trigger a cascading failure when exposed to concurrent, unpredictable production workloads. Platform teams building distributed systems find this out the hard way.
Kubernetes is a declarative system. Engineers define the desired state in YAML manifests, and Kubernetes continuously works to match that state. The problem is that Kubernetes follows instructions exactly as written. If a configuration contains a mistake, the cluster will repeatedly apply that mistake even when it causes resource exhaustion, restart loops, or full service outages.
In platform engineering, these recurring mistakes are known as Kubernetes anti-patterns. Most are difficult to detect during development because they are technically valid configurations. Deployments succeed, pods appear healthy, and everything works under low traffic. Under production load, small configuration decisions can quickly become large-scale failures.
This guide covers 10 Kubernetes anti-patterns that commonly affect production systems, explains why they happen, and shows the practical fixes used in real production environments.
Anti-Pattern 1: Using Latest Image Tags
Using mutable image tags like :latest or :v1.2 is one of the most common deployment mistakes in Kubernetes production environments. At first, this setup looks completely fine. The deployment works, pods start normally, and everything passes testing. The real problem appears later when the cluster starts scaling under real production traffic.
In container registries, tags are mutable references. The image behind a tag can be replaced without changing the tag name itself. A :latest tag may point to a completely different application build tomorrow. OCI-compliant registries support immutable tag policies, but many teams do not enforce them leaving mutable tags as a silent reliability risk.
The Split-Brain Deployment Problem
Kubernetes works using state reconciliation. The kubelet only pulls a new image when the pod specification changes, or when imagePullPolicy forces a fresh pull during scheduling.
When a CI/CD pipeline pushes a hotfix to the same :latest tag, existing pods continue running the old image. But when the deployment scales up, newly created pods pull the updated image. The result is a silent split-brain deployment some pods serve the old version, others serve the new version. From Kubernetes's perspective, everything belongs to the same Deployment revision, which makes debugging extremely difficult during incidents.
Rollback workflows become unreliable once image tags stop representing immutable builds. Even if ArgoCD rolls back to a previous Git commit, the manifest still references the same mutable tag. Kubernetes pulls the overwritten image again and the rollback fails silently.
A More Reliable Approach: SHA256 Digest Pinning
Production workloads should always use immutable SHA256 image digests instead of mutable tags. A digest uniquely identifies one exact container image build and cannot be overwritten. This guarantees that every pod in the cluster runs the exact same binary.
Production YAML Implementation:
| apiVersion: apps/v1 kind: Deployment metadata: name: payment-service spec: replicas: 3 template: spec: containers: - name: api-server # Anti-pattern # image: registry.internal/payment-service:latest # Recommended production configuration image: registry.internal/payment-service@sha256:4a1c4b21597c1b4415bdbecb28a3297c6eb2b5fca52b2f6b8b1a8f942976d997 imagePullPolicy: IfNotPresent |
Audit command — check what image digest is currently running in a deployment:
| # Lists the exact image digest running in each pod kubectl get pods -o jsonpath='{range .items[*]}{.metadata.name}{"\t"}{.spec.containers[*].image}{"\n"}{end}' |
By deploying via digests, rollbacks become instantaneous and reliable. The exact same build tested in staging is guaranteed to run in production.
Anti-Pattern 2: Missing Resource Limits (or Misconfigured Limits)
Running workloads without proper CPU and memory configuration is one of the fastest ways to destabilize a Kubernetes cluster. Some teams skip resource requests and limits entirely. Others configure them without understanding how Kubernetes maps these settings to the Linux kernel producing YAML that appears correct but creates real production problems.
Without resource requests, the scheduler cannot correctly distribute workloads across nodes. Under heavy traffic, this leads to node starvation, noisy-neighbor problems, and unstable pod performance.
CFS Quotas vs OOM Killer
Kubernetes resource controls are implemented using Linux cgroups. CPU and memory behave very differently at the kernel level.
CPU Limits (Compressible Resource)
CPU is a compressible resource. When a container reaches its CPU limit, the Linux Completely Fair Scheduler (CFS) throttles the process rather than killing it. For JVM-based applications this is particularly dangerous: throttled CPU slows garbage collection while incoming traffic continues allocating objects in memory. Heap pressure builds until the application crashes the root problem looks like a memory issue but the actual cause is CPU throttling.
Memory Limits (Non-Compressible Resource)
Memory cannot be throttled gradually. If a container exceeds its memory limit, the Linux kernel invokes the OOM Killer immediately and terminates the process. In Kubernetes this appears as a pod termination with reason OOMKilled (Exit Code 137), usually leading to restart loops during traffic spikes.
Debugging command — check live resource usage before reading logs:
| # Check real-time memory and CPU per container kubectl top pods --containers -n <namespace> # Describe pod to see current limits and recent OOM events kubectl describe pod <pod-name> | grep -A10 "Limits\|OOMKilled" |
A More Reliable Approach:
| Important: A pod only receives Guaranteed QoS when EVERY container in the pod has cpu request equal to cpu limit AND memory request equal to memory limit. If any single container has cpu request 250m and cpu limit 500m, even if memory is equal the entire pod is classified Burstable, not Guaranteed. Guaranteed QoS receives oom_score_adj = -997, making it the hardest to OOM-kill under node pressure. |
For CPU limits specifically: some platform teams omit CPU limits on latency-sensitive services to reduce CFS throttling. This can improve response time but requires careful node capacity planning and strong workload isolation without CPU limits, a pod can consume spare CPU cycles from neighbours on the same node. This approach should only be used with dedicated node pools or taint/toleration-based isolation to prevent noisy-neighbour effects.
Production YAML - Guaranteed QoS (all requests must equal all limits):
| # Guaranteed QoS -- requests equal limits for memory-sensitive services resources: requests: memory: "512Mi" cpu: "250m" limits: memory: "512Mi" # Equal to request = Guaranteed QoS cpu: "500m" # Set higher than request to avoid CFS throttle |
Anti-Pattern 3: Running Everything in One Giant Cluster
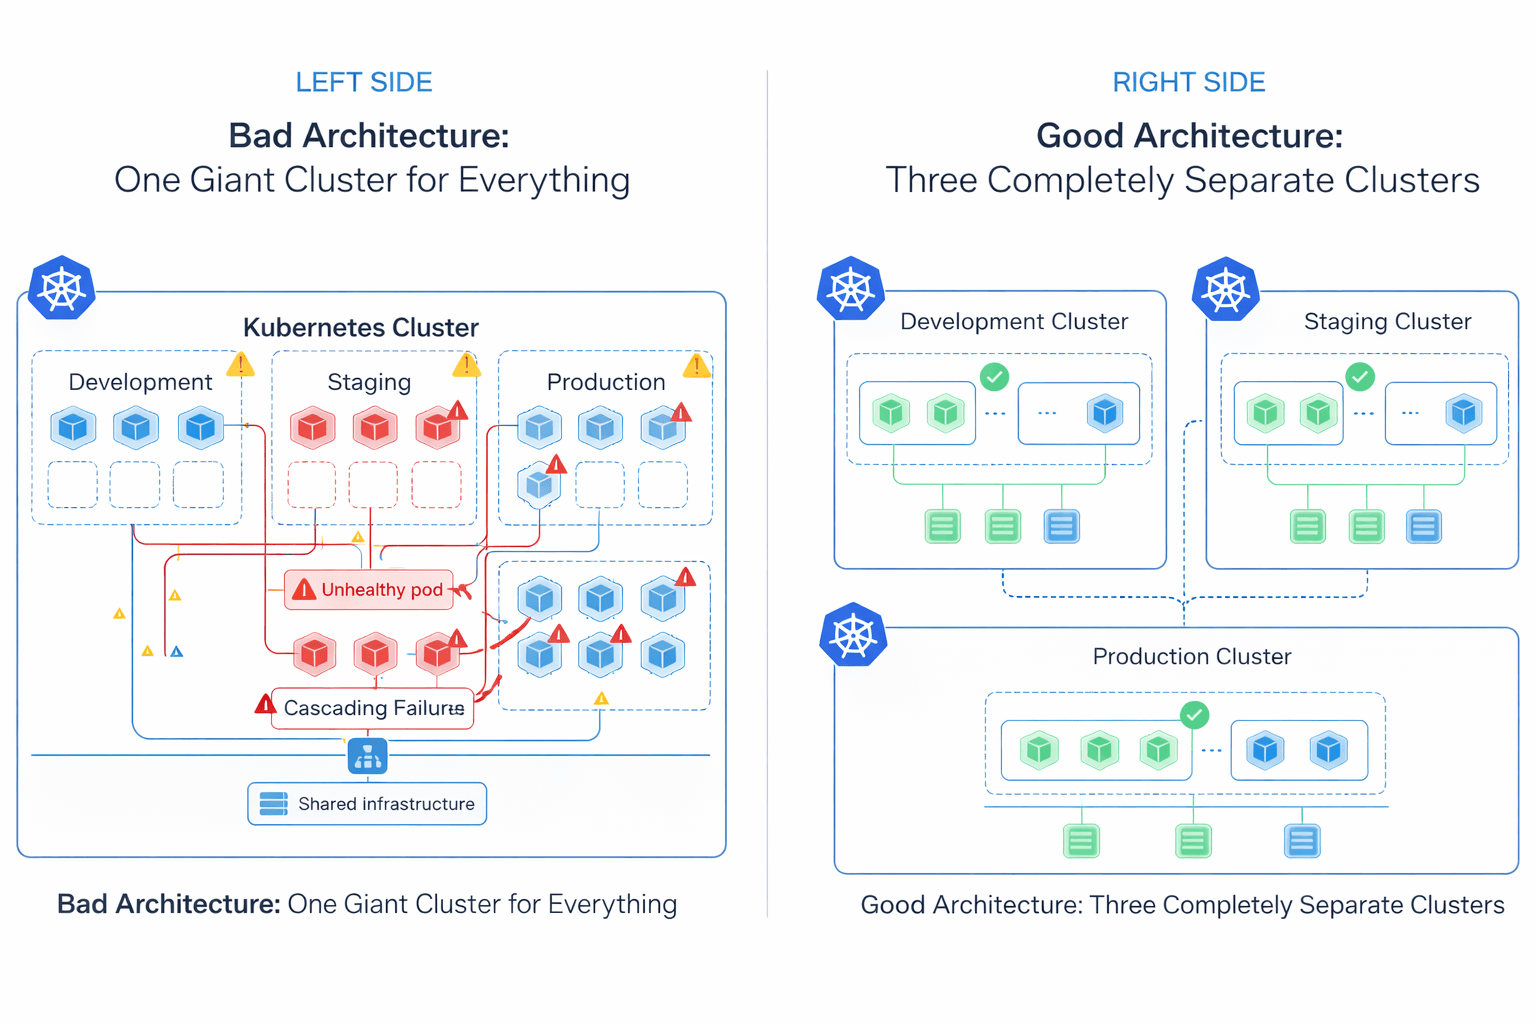 Running all environments and business domains inside a single Kubernetes cluster may look easier to manage at first, but it creates a large operational blast radius. Many organizations start with one shared cluster for production, staging, development, internal tools, and background jobs. As the platform grows, the cluster becomes harder to operate, secure, and troubleshoot.
Control Plane and Network Blast Radius
At large scale, Kubernetes control plane performance becomes dependent on etcd. By default, etcd enforces a strict 2GB storage quota via the quota-backend-bytes flag. If this limit is exceeded without compaction configured, the cluster enters a read-only alarm state and stops accepting any writes including pod scheduling and Secret updates. Managed providers typically raise this ceiling, with the etcd project recommending a maximum of 8GB for normal environments. etcd is also sensitive to disk I/O latency above 10ms, where Raft consensus timeouts begin to affect API server responsiveness.
The problem is not limited to the control plane. Many Kubernetes configurations are cluster-scoped: network policies, DNS configuration, admission controllers, RBAC rules, and CNI plugins like Calico. A misconfigured global network policy or broken CoreDNS update applied in a staging namespace can accidentally affect networking across the entire cluster.
A More Reliable Approach: Fleet Architecture
Modern platform teams reduce this risk by using multiple smaller Kubernetes clusters instead of one massive shared cluster commonly called fleet architecture. Clusters are separated by environment, business domain, compliance boundary, or workload type. If a staging cluster breaks, production traffic remains completely unaffected.
This approach does increase operational overhead: each cluster requires its own upgrade lifecycle, RBAC configuration, GitOps pipeline, monitoring stack, and identity management setup. Fleet architecture trades blast radius for operational complexity the right tradeoff depends on team size, compliance requirements, and the cost of a production outage.
Anti-Pattern 4: Misconfigured Health Probes
Health probes are one of the most important reliability features in Kubernetes. When configured incorrectly, they become one of the fastest ways to take down a production system. A common mistake is coupling liveness probes directly to external dependencies like databases, Redis, or third-party APIs.
The Cascading Restart Problem
A liveness probe answers one question: is this container process still alive and responsive? If the probe fails, Kubernetes assumes the container is unhealthy and restarts the pod. The architecture fails when dependencies are tightly coupled to health endpoints.
With 50 application pods running, a 10-second database latency spike causes all 50 liveness probes to fail simultaneously. Kubernetes restarts all 50 pods. Every restarted pod immediately opens new database connections. The already-struggling database receives a thundering herd of reconnects, a minor slowdown escalates into a multi-hour outage because Kubernetes continuously restarted healthy application processes that were never actually broken.
Debugging command – check probe events before reading application logs:
| # Check probe failures in the event stream first kubectl describe pod <pod-name> | grep -A5 "Liveness\|Readiness\|Warning" #Check recent events across the namespace kubectl get events -n <namespace> --sort-by=.lastTimestamp | grep -i "probe\|unhealthy" |
A More Reliable Approach:
| Rule: Liveness probes must only check internal application health, never external databases, message queues, or downstream APIs. Readiness probes are the correct tool for checking dependency availability. A failing readiness probe removes the pod from the Service endpoints list (stops traffic routing) without killing the process, which prevents restart storms during temporary infrastructure slowdowns. |
Production YAML — separated probe responsibilities:
| # Liveness: internal process check only livenessProbe: httpGet: path: /healthz # lightweight internal check -- no DB port: 8080 initialDelaySeconds: 10 periodSeconds: 15 failureThreshold: 3 # Readiness: dependency check -- stops traffic, never kills pod readinessProbe: httpGet: path: /ready # checks DB, cache, downstream services port: 8080 initialDelaySeconds: 5 periodSeconds: 10 failureThreshold: 3 |
Anti-Pattern 5: Storing Secrets in Git
As teams adopt GitOps workflows, a common mistake is committing Kubernetes Secret manifests directly into Git repositories. Many engineers assume Kubernetes Secrets are encrypted by default. In reality, native Kubernetes Secret objects only store data as Base64-encoded values. Base64 is not encryption it is an encoding format. Anyone with repository access can decode the secret in one command.
The Base64 Reality
Decoding a Kubernetes Secret takes one second:
| # Anyone with kubectl access can do this kubectl get secret <secret-name> -o jsonpath='{.data.password}' | base64 -d # Output: your plaintext production password |
Once a secret is committed to Git, it lives in the repository history permanently even after deletion. Cloned repositories, CI/CD logs, pull request history, and backup systems may all contain copies of the exposed credential. RBAC policies on the Kubernetes API server control who can read Secrets at runtime, but they cannot remove credentials already exposed through Git history.
A More Reliable Approach: External Secret Management
Production Kubernetes platforms should never store raw credentials inside Git repositories. Instead, secrets should be managed using dedicated external secret managers such as AWS Secrets Manager, Azure Key Vault, or HashiCorp Vault. RBAC policies should also restrict kubectl get secret access to only the service accounts and humans that genuinely require it.
A common production approach is using the External Secrets Operator (ESO). Engineers commit only a safe reference to the secret in Git not the credential itself. ESO authenticates with the external vault at runtime and injects the secret into Kubernetes as a native Secret object.
Production ESO ExternalSecret reference (safe to commit to Git):
| apiVersion: external-secrets.io/v1beta1 kind: ExternalSecret metadata: name: db-credentials spec: refreshInterval: 1h secretStoreRef: name: aws-secretsmanager kind: ClusterSecretStore target: name: db-credentials data: - secretKey: password remoteRef: key: prod/db/password # reference only, actual secret stays in vault |
Anti-Pattern 6: Managing Every Internal Service with Highly Generic Helm Charts
Helm excels at packaging complex, versioned third-party applications where dependency management and upgrade paths matter Prometheus, Grafana, ingress controllers, and cert-manager are well-served by Helm. Many teams reach for the same templating approach for their own internal microservices. What starts as convenient reusability can become a maintenance burden as charts grow.
Growing Template Complexity
To support many services with a single reusable chart, teams introduce conditional logic, nested templates, environment-based overrides, and dynamic YAML generation. As more configurations are added, values.yaml files grow larger and harder to review. Engineers need to trace both the Kubernetes manifests and the Helm template logic generating them. Helm does provide tooling to inspect rendered output before applying:
| # Render templates locally to inspect final manifests before applying helm template my-release ./my-chart -f values-production.yaml # Inspect what manifests are currently applied to the cluster helm get manifest my-release -n production |
A More Reliable Approach: Kustomize Overlays
For internal applications, some platform teams prefer Kustomize. It operates directly on standard Kubernetes YAML using overlays and patches keeping configuration declarative and reviewable without a Go templating layer. This makes manifests easier to audit, diff, and onboard new engineers onto.
| # Apply a specific environment overlay directly kubectl apply -k overlays/production/ |
Helm remains the better choice for third-party applications and ecosystem packages where dependency management and release history matter. Many mature platform teams use both: Kustomize for internal services, Helm for external dependencies. The right choice depends on chart complexity and how many engineers need to read and modify it under production pressure.
Anti-Pattern 7: Treating Kubernetes Like a Traditional VM Platform
A common pattern during Kubernetes adoption is moving existing VM-based applications into containers without fully adapting them to Kubernetes behavior often called "lift and shift." In many cases the application works at first. But Kubernetes handles infrastructure very differently from traditional virtual machines, especially during scaling events, rolling deployments, and node shutdowns.
The PID 1 and Graceful Shutdown Problem
Traditional virtual machines run an init system such as systemd which handles process signals, manages child processes, and coordinates graceful shutdown. In containers, the application itself often runs directly as Process ID 1 (PID 1).
When Kubernetes scales down a deployment, replaces a pod, drains a node, or performs a rolling update, the kubelet sends a SIGTERM signal to the container process. The application is expected to stop accepting new requests, finish active work, close database connections, and shut down cleanly within the terminationGracePeriodSeconds window. Applications that ignore SIGTERM get forcefully killed with SIGKILL after this timeout interrupting inflight HTTP requests, active database transactions, and background jobs. PodDisruptionBudgets (PDBs) are worth configuring alongside graceful shutdown: they prevent Kubernetes from draining too many pods simultaneously during node maintenance, giving applications time to handle traffic handoffs cleanly.
A More Reliable Approach:
Applications running on Kubernetes should handle SIGTERM gracefully: stop accepting new requests, allow existing requests to complete, drain connection pools, and exit cleanly. For applications that cannot be easily modified, lightweight init systems like dumb-init or Tini correctly forward Linux signals from Kubernetes to child processes:
| # Dockerfile entrypoint using dumb-init for correct signal forwarding FROM node:20-alpine RUN apk add --no-cache dumb-init ENTRYPOINT ["dumb-init", "--"] CMD ["node", "server.js"] |
Anti-Pattern 8: Limited Observability in Kubernetes
Observability becomes increasingly important as Kubernetes environments grow in size and complexity. In smaller systems, basic metrics and application logs are enough to troubleshoot most issues. But in large microservice platforms with hundreds of services communicating across the network, traditional monitoring approaches often cannot surface the root cause of production incidents fast enough.
This gap becomes especially noticeable during network latency spikes, intermittent packet loss, DNS resolution failures, and service-to-service communication issues that exist below the application layer.
Traditional Monitoring Limitations
Many platforms rely on application logs, metrics scraping, sidecar proxies, and agent-based monitoring. These approaches operate at the application or user-space level. Low-level networking problems inside the Linux kernel TCP retransmissions, dropped packets, connection tracking exhaustion, DNS latency, socket-level issues may not appear clearly in traditional dashboards.
eBPF and Kernel-Level Visibility
Modern Kubernetes platforms increasingly use eBPF-based observability tools for deeper system visibility. eBPF allows lightweight programs to run directly inside the Linux kernel in a secure and controlled way, providing visibility into network traffic, DNS resolution, TCP behavior, system calls, and HTTP request flow without requiring changes to application code or container restarts.
Tools like Cilium, Pixie, and Groundcover use eBPF to collect telemetry directly from kernel-level events such as kprobes, tracepoints, and network hooks. This makes it possible to identify dropped packets that never reach the application layer and therefore never appear in application logs.
eBPF tooling also introduces operational considerations: kernel version compatibility must be validated before deployment (most production tooling requires Linux 5.10 or newer), telemetry cardinality can grow rapidly in high-pod-count clusters without retention policies, and the tooling requires deeper Linux networking expertise to interpret correctly.
| PromQL Alert: rate(node_network_receive_drop_total[5m]) > 0 alerts on packet drops at the node network interface level, which application logs will never surface. |
Anti-Pattern 9: Using the Same Autoscaling Strategy for Every Workload
Autoscaling is one of Kubernetes's most powerful features, but different workload types require different scaling strategies. Many teams rely entirely on CPU-based autoscaling for every service in the cluster. While this works well for synchronous HTTP APIs, it is not appropriate for asynchronous or queue-based workloads.
The HPA Metric Lag Problem
The native Kubernetes Horizontal Pod Autoscaler (HPA) scales workloads using CPU utilization and memory usage. For synchronous HTTP APIs, incoming traffic increases CPU immediately. Queue-based systems behave differently.
When 50,000 messages enter a Kafka or RabbitMQ queue and existing workers are still processing at normal throughput, CPU usage has not spiked yet. The HPA does not react. Queue depth grows, message lag increases, and scaling happens much later than needed. Native HPA deployments also traditionally maintain at least one running replica meaning idle workers continue consuming compute resources even when the queue is empty overnight, though this can be worked around with custom metric integrations.
A More Reliable Approach: Event-Driven Scaling with KEDA
For asynchronous workloads, KEDA (Kubernetes Event-Driven Autoscaler) scales based on external event sources such as Kafka queue depth, RabbitMQ message count, cloud messaging systems, and custom event metrics. KEDA also provides mature scale-to-zero behavior workers are removed entirely when the queue is empty and spun back up when messages arrive.
Production KEDA ScaledObject:
| apiVersion: keda.sh/v1alpha1 kind: ScaledObject metadata: name: worker-scaledobject spec: scaleTargetRef: name: worker-deployment minReplicaCount: 0 # scales to zero when queue is empty maxReplicaCount: 50 triggers: - type: rabbitmq metadata: queueName: job-queue queueLength: "100" # add one worker per 100 messages hostFromEnv: RABBITMQ_HOST |
| Note: The native HPA remains the correct solution for API servers, synchronous applications, and CPU-bound services. For event-driven systems, queue-aware scaling with KEDA provides better responsiveness and infrastructure efficiency. |
Anti-Pattern 10: Running Every Workload on Kubernetes
As Kubernetes adoption matures inside organizations, platform teams sometimes begin treating the cluster as the default destination for every new workload, internal tooling, lightweight APIs, scheduled jobs, and batch workers all accumulate inside the same orchestration layer regardless of whether they actually require Kubernetes-level operational flexibility.
The issue is not that Kubernetes is inappropriate. The issue is that distributed orchestration introduces its own operational cost model.
Understanding the Operational Overhead
Operating Kubernetes in production involves significantly more than running containers. Platform teams must maintain cluster upgrades, admission policies, RBAC boundaries, ingress architecture, certificate rotation, observability pipelines, node lifecycle management, backup procedures, autoscaling behavior, and network policy enforcement. In larger environments these investments are justified. Smaller systems often do not benefit from that level of orchestration.
A low-traffic internal API with predictable usage patterns may run more reliably on a managed container platform or serverless runtime with far less operational overhead. Similarly, scheduled batch jobs or lightweight event processors may not require persistent cluster infrastructure or multi-layer observability stacks.
A More Reliable Approach: Right-Sizing Infrastructure
Production platform engineering is fundamentally an exercise in operational tradeoff management. The most resilient infrastructure decisions are the ones that minimize unnecessary complexity while still meeting scaling, reliability, compliance, and deployment requirements.
Kubernetes delivers the most value in environments that genuinely require large-scale service orchestration, multi-team platform standardization, advanced traffic management, workload portability, multi-cluster deployment models, fine-grained scheduling control, and high-density infrastructure utilization.
The goal is not to maximize Kubernetes adoption. The goal is to select the operational model that best matches the system's actual reliability, scaling, and maintenance requirements.
The Application Readiness Checklist:
Before a new application serves production traffic, platform engineers verify it meets the following operational standards:
| Requirement | What to Check |
| Immutable Image Digests | All containers use SHA256 digest pinning no :latest or mutable tags |
| Resource Requests & Limits | CPU and memory requests defined; memory limits equal requests for latency-sensitive services (Guaranteed QoS) |
| Separated Health Probes | Liveness checks internal process only; Readiness checks external dependencies |
| Secrets External | No raw credentials in Git; External Secrets Operator or equivalent in use |
| HA Topology Spreading | topologySpreadConstraints configured to spread pods across nodes and zones |
| Graceful Shutdown | App handles SIGTERM; terminationGracePeriodSeconds matches actual drain time |
| Autoscaling Strategy | HPA for synchronous services; KEDA for queue/event-driven workloads |
| Observability | Metrics, structured logs, and distributed traces in place; eBPF-based network visibility for complex CNI issues |
Frequently Asked Questions (FAQs)
Why do Kubernetes pods get OOMKilled instead of throttled?
CPU is a compressible resource in Linux, meaning Kubernetes can slow workloads down through throttling when they hit their limits. However, memory is not compressible; if a container exceeds its memory limit, the Linux kernel invokes the OOM (Out-of-Memory) killer to terminate the process instantly (Exit Code 137) to protect the underlying node's stability.
Why shouldn't we use :latest image tags in production?
Image tags are mutable references, meaning the underlying container image pointed to by a tag like :latest or :v1 can be overwritten in the registry at any time. This unpredictability breaks GitOps workflows and causes split-brain scenarios during cluster autoscaling. Instead, platform engineers should pin images by their immutable SHA256 digest to prevent tag mutation attacks and guarantee fully reproducible deployments.
How does KEDA improve upon the standard Horizontal Pod Autoscaler (HPA)?
The standard HPA adjusts replica counts based on internal resource metrics like CPU or memory, and has a hard minimum of one running replica. KEDA (Kubernetes Event-Driven Autoscaler) fills this gap by allowing you to scale workloads based on external event triggers (such as a Kafka message queue depth). Most importantly, KEDA enables true scale-to-zero behavior, removing idle pods completely when no events are present to save infrastructure costs.
What is the difference between a Liveness probe and a Readiness probe?
A Liveness probe checks if a container is still running correctly and will forcefully restart the container if it detects a deadlock. A Readiness probe checks if the container is currently prepared to handle live network traffic; if it fails, Kubernetes simply removes the pod from the Service endpoint list without restarting it, allowing the pod time to gracefully recover.
How does eBPF observability outperform traditional monitoring in Kubernetes?
Traditional monitoring relies on injecting heavy sidecar proxies or user-space agents that consume significant CPU and memory. eBPF (Extended Berkeley Packet Filter) integrates directly into the Linux kernel space, allowing teams to observe network traffic, system calls, and application latency with near-zero overhead and without requiring any code modifications.