

Every engineering team eventually reaches the same inflection point. A pipeline that felt effortless at ten commits a day begins to strain under two hundred. Builds stretch longer, test suites crawl, and developers start treating every push as an excuse to step away rather than a quick checkpoint. The common response is to blame the tooling, switch CI providers, or throw more compute at the problem. None of that addresses the actual cause.
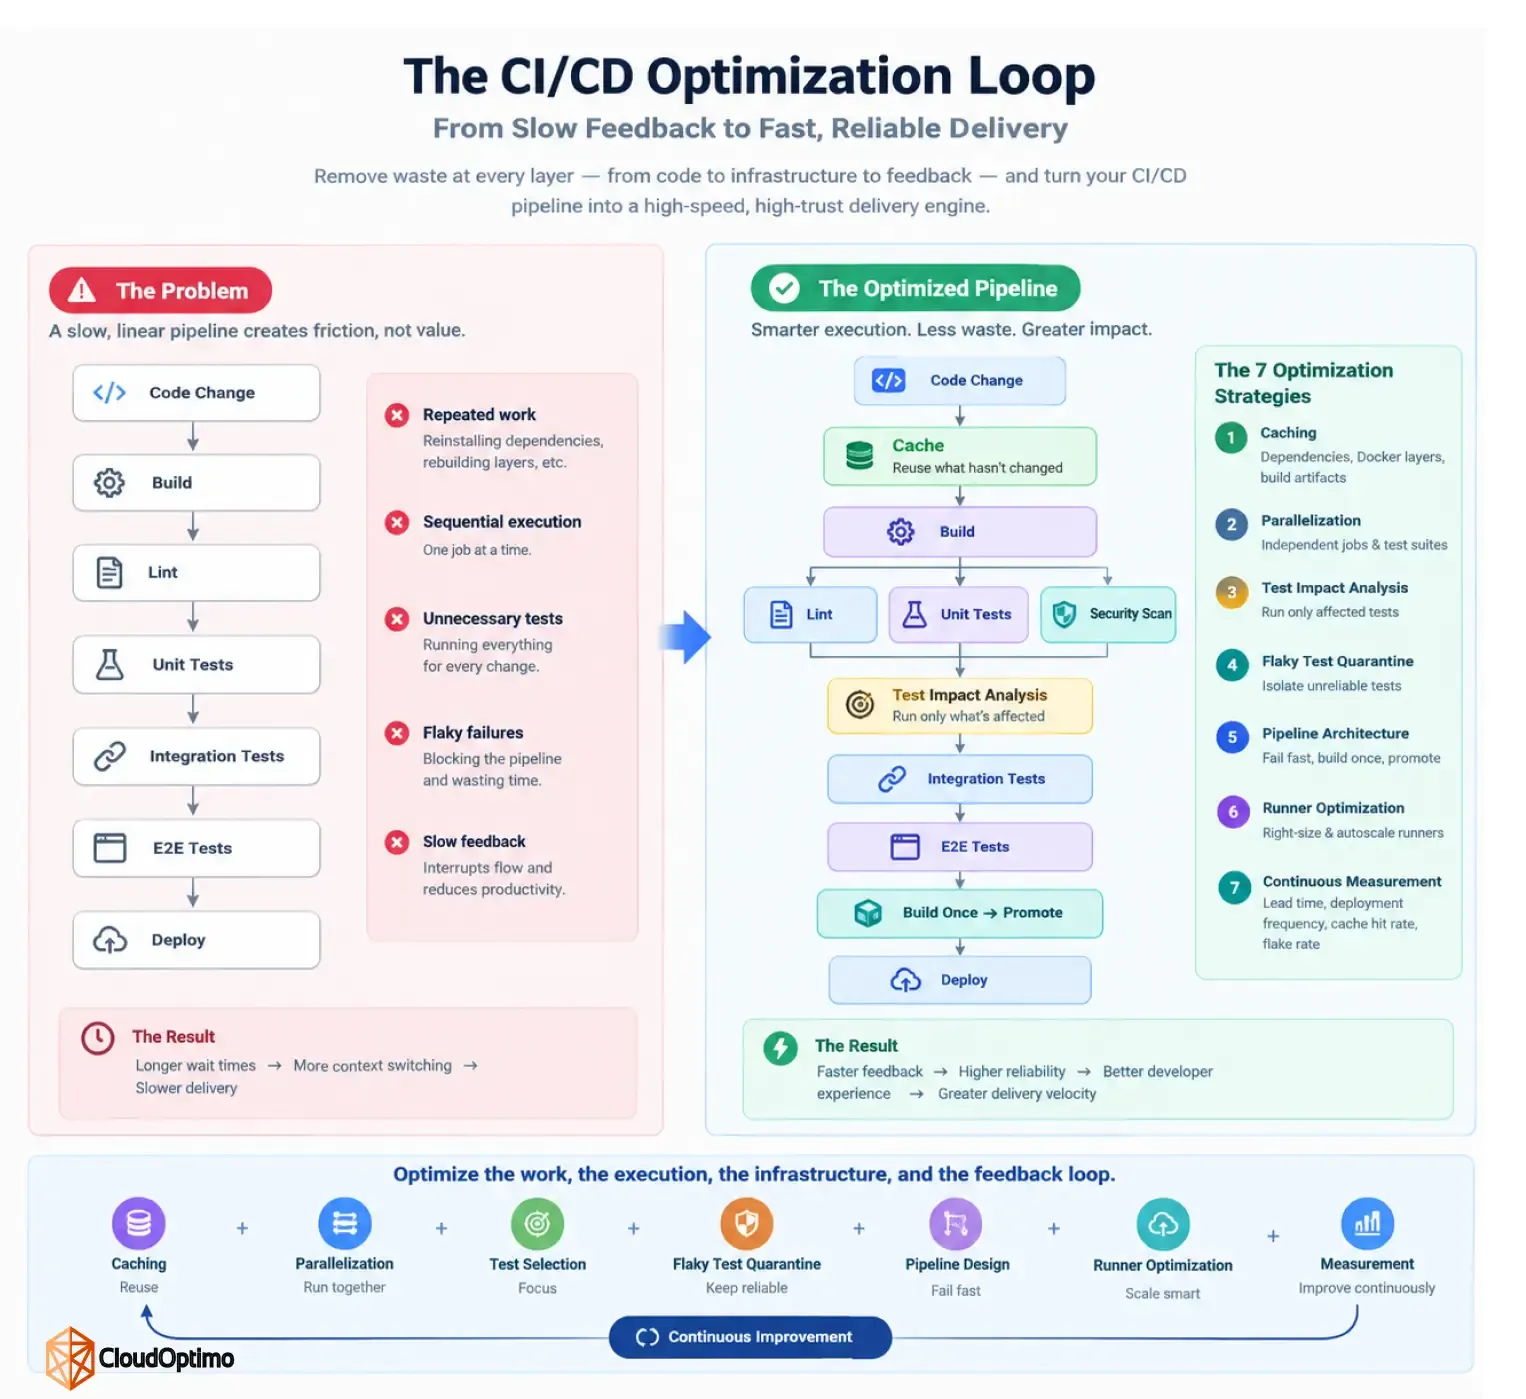
Pipeline speed is rarely one problem. It is typically eight smaller ones compounding on each other: redundant rebuilds, jobs running sequentially when they could run in parallel, test suites executing far more than a given change requires, flaky tests nobody trusts anymore, an architecture that treats every commit with the same weight as a production deploy, infrastructure that is either undersized or overspent, and little to no visibility into any of it.
This blog walks through each of these layers in the order that matters most, beginning with why a slow pipeline costs far more than the minutes it shows on the clock.
1. Why Pipeline Speed Actually Matters
The Eight Minutes That Cost More Than Eight Minutes
Picture a developer pushing a commit, leaning back, and opening Slack "just for a minute" while the build runs. Eight minutes later, the pipeline finishes, but that developer is three conversations deep into something else entirely. By the time they circle back, they have to rebuild the entire mental model they had of the code: which variables meant what, which edge case they were chasing, why a certain line was written the way it was.
The Hidden Tax on Flow
This is the real cost of a slow pipeline. It is not just the eight minutes on the clock. Slow CI/CD pipelines have real financial, operational, and cultural costs that can quietly erode a team's productivity and morale, and the true cost is often much higher than most leaders realize.
Every wait is an invitation to drift, and every drift comes with a tax on return. Studies suggest that 30 to 60 percent of CI wait time is genuinely lost to interrupted flow and unproductive task switching, not just idle minutes.
Why Ten Minutes Is the Magic Number
There is a reason elite engineering organizations obsess over a specific threshold. Industry benchmarks recommend keeping the full pipeline under ten minutes from commit to feedback, since that is the point below which developers stay in flow.
The DORA Connection
This links directly to how the industry measures engineering performance at large. DORA's State of DevOps reports consistently rank lead time and deployment frequency as the strongest predictors of organizational performance, and CI wait time directly drives both.
A slow pipeline does not just annoy developers. It quietly caps how good an entire delivery process can ever become.
2. Caching Strategies That Actually Work
What If the Wait Never Had to Happen
Go back to that eight-minute build. Most of those minutes were not spent compiling code. They were spent redoing work the pipeline had already done a hundred times before: reinstalling the same dependencies, rebuilding the same Docker layers, refetching packages that had not changed since last Tuesday. This is the first place speed comes from, and it is often the single most effective change a team can make. Caching is the single most impactful optimization for most pipelines, capable of cutting pipeline time by 40 to 60 percent in typical setups.
The Three Things Worth Caching
Not everything deserves a cache slot, but three categories consistently pay off: dependency installs, Docker layers, and build artifacts. Reusing dependency installs, build artifacts, and Docker layers across runs is the second move after parallelization, right behind it in impact. Done well, the payoff is dramatic. A cache hit can reduce build time from 10 minutes to 30 seconds.
The Trap Nobody Warns You About
Here is the part most guides skip. A cache is not automatically a win. Research studying real GitHub pipelines found that misconfigured caches were often slower than having no cache at all. The usual culprit is a lazy cache key. Ignoring caching strategy is a common failure mode because poor cache keys negate benefits, silently serving stale dependencies or forcing full rebuilds anyway.
Cache Keys Are the Real Skill
The fix is treating cache key design as an engineering decision, not an afterthought. Keys should reflect exactly what changes, usually a hash of the lockfile or dependency manifest, so the cache invalidates only when it truly must and stays warm everywhere else. Get this right, and an eight-minute wait quietly becomes a two-minute one, before parallelization even enters the picture.
3. Parallelization & Concurrent Execution
The Next Bottleneck After Caching
Caching fixes redundant work, but most pipelines still run everything in a straight line: build, then lint, then unit tests, then integration tests, one after another like cars stuck behind a single stoplight. The fix is not doing less work. It is doing the same work at the same time. A test suite that takes 30 minutes to run sequentially can finish in 5 minutes when split across 6 parallel jobs.
Matrix Builds, the Easy Win
Most modern CI platforms make this almost embarrassingly simple. GitHub Actions, GitLab CI, and CircleCI all support matrix builds, where a single job definition spins up multiple parallel instances, each handling its own slice of test files, language versions, or platforms. Teams should parallelize aggressively by splitting test suites, using matrix builds, and running independent jobs concurrently.
DAGs Replace the Straight Line
The deeper fix goes beyond splitting one job. GitLab CI and similar platforms let teams replace stage based execution with explicit job dependencies, so jobs run as soon as their dependencies complete rather than waiting on an entire stage to finish. This is the same idea Gradle and Bazel use internally, building a graph of tasks and executing every independent branch at once.
The Trap Hiding Inside Parallelism
Parallelism has its own version of the caching trap. Splitting tests randomly creates imbalanced shards, where one runner finishes in two minutes and another drags on for twenty, quietly erasing the benefit. The fix is content-based splitting using historical timing data, so every shard finishes in roughly equal time.
4. Smarter Test Execution (Test Impact Analysis)
The Suite That Grew Too Big to Run
Parallelism helps spread tests across more runners, but it does not solve a deeper problem. As a suite grows to thousands of tests, every single commit, even a one-line copy change, still triggers all of them. Running every test on every change feels safe, but it is often the wrong tradeoff once a codebase reaches real scale.
Running Only What the Change Touched
The smarter approach is called test impact analysis, and the idea is simple: map each test to the production code it actually exercises, then run only the tests affected by a given change. Test Impact Analysis tools like Datadog, Bazel, and Nx enable execution of only those tests affected by a specific code change, reducing CI times by 40 to 70 percent. AI driven versions push this further.
Choosing the Right Shape of Coverage
This is also where the test pyramid versus test trophy debate matters. A pricing engine with complex business logic still warrants the pyramid, heavy on fast unit tests. A React component that mostly fetches, displays, and writes data is better served by the trophy model, weighted toward integration tests that mirror real usage.
The One Rule That Keeps This Honest
None of this works if skipped coverage is invisible. If a pipeline skips a check, the reason should be inspectable, and if a gate is relaxed, its owner should know exactly why.
5. Taming Flaky Tests
The Test That Cried Wolf
Test impact analysis makes a pipeline leaner, but it also exposes a problem that had been hiding in plain sight. A handful of tests fail and pass at random, with no code change in between. Nobody trusts them anymore, so teams just rerun the whole job and hope. In 2026, flaky tests are not just an annoyance, they are a blocker for modern CI/CD, and the cost is measurable: flaky tests incur a cost of 6 to 8 hours per engineer per week in diagnostics and unnecessary reruns.
Quarantine, Not Deletion
The fix is not blind retries. It is a deliberate two-step process. First, identify the flaky test and pull it out of the blocking path so it stops failing pull requests it has no business failing. Flaky test quarantine is the practice of automatically isolating tests that pass and fail non-deterministically, while keeping them running in a separate lane until they are fixed or deleted. The key word is separate. Quarantine is for flakiness, not for failures, and a test that fails consistently is a real bug, not a candidate for isolation.
Keeping Quarantine From Becoming a Graveyard
Left unmanaged, a quarantine lane quietly turns into a place where broken tests go to be forgotten. The discipline that prevents this is ownership. Track quarantined tests with owners, reasons, and expiry dates, and review that list in the same forum where the team reviews its testing metrics.
6. Pipeline Architecture Redesign
Rethinking the Shape of the Pipeline Itself
Caching, parallelism, smarter tests, and flaky test quarantine all make individual jobs faster. But the pipeline as a whole is often still shaped wrong. It runs the same heavy checks on every single pull request that it runs before a production deploy, as if every commit carried equal risk.
Fail Fast, on Purpose
The fix starts with ordering. Quick validation jobs like linting and type checking belong first, with minimal dependencies, so failures are caught before slower stages ever start. Only once those pass should unit tests run, then integration tests, then the slowest end to end suite, each stage a filter for the next.
Two Pipelines, Not One
The deeper redesign splits the pipeline itself. A pull request pipeline stays fast and lean, covering build, lint, unit tests, and basic security checks for quick feedback. The main branch pipeline can afford to be comprehensive, running the full test suite, complete security scans, and staging deployment for thorough verification before anything reaches production.
Build Once, Trust Everywhere
The last piece is artifact discipline. Rebuilding artifacts per environment is a common and costly mistake. Promoting the same tested artifact through staging and production is safer, since it guarantees the exact binary that passed every check is the one that ships.
7. Infrastructure & Runner Optimization
The Speed You Cannot Cache or Parallelize Away
Even with a lean pipeline, smart tests, and clean architecture, there is a layer underneath all of it that quietly sets the ceiling on how fast anything can go: the machine the pipeline actually runs on. A tiny runner working through a heavy build behaves the same way a small engine behaves on a steep hill, no matter how well the route was planned.
Right-Sizing Before Anything Else
The instinct is often to throw the biggest available machine at every job, but that is not right-sizing, it is overspending. Companies spend about 15 to 20 percent of their development budget on CI/CD infrastructure on average, and the fix is not blind upgrades but monitoring utilization first before overscaling runners.
Autoscaling and the Off-Peak Advantage
Runner fleets that scale to zero when nobody is pushing code, then scale back up on demand, capture the biggest savings. Teams deploying self-hosted runners on spot instances with autoscaling and off-peak scale-to-zero configured report 70 to 90 percent cost reductions compared to managed runner pricing.
Self-Hosted or Cloud, Not Dogma
Neither option wins universally. If usage is under 20,000 minutes a month, cloud runners are almost certainly cheaper and simpler, while self-hosted infrastructure only pays off once volume clears that threshold and someone owns the operational overhead that comes with it.
8. Measuring, Monitoring & Continuously Improving
You Cannot Fix What You Cannot See
Every optimization covered so far, caching, parallel jobs, smarter test selection, flaky test quarantine, architecture redesign, and right-sized runners, only stays fixed if someone is watching. Pipelines drift. A cache key that worked six months ago silently stops matching. A new dependency quietly reintroduces a slow, unparallelized step. Without visibility, all of that regresses unnoticed.
The Metrics Worth Watching
The starting point is measuring pipeline health with DORA metrics, since lead time and deployment frequency reveal whether a pipeline is actually helping teams ship or just running fast in isolation. Underneath those top-line numbers, two operational metrics matter just as much: cache hit rate, which shows whether the caching strategy from section two is still doing its job, and flake rate, which shows whether the quarantine discipline from section five is holding or quietly filling back up.
Turning Metrics Into a Habit, Not a One-Time Project
The teams that stay fast are the ones that build a culture of continuous improvement around these numbers, reviewing them on a regular cadence rather than only when someone complains about a slow build.
The Real Finish Line
None of this is really about shaving minutes off a build. It is about protecting the one thing every other improvement in this blog depends on: a developer's ability to stay in flow, trust their pipeline, and ship with confidence.
Taken together, these strategies provide a practical framework for improving CI/CD pipeline speed, reliability, and efficiency:
| Optimization Strategy | What It Improves | How It Helps |
| Caching | Dependencies, Docker layers, and build artifacts | Reuses work from previous runs instead of rebuilding or downloading the same data |
| Parallelization | Independent jobs and test suites | Runs work concurrently to reduce overall pipeline execution time |
| Test Impact Analysis | Test execution | Runs tests affected by a code change instead of unnecessarily running the entire suite |
| Flaky Test Quarantine | Test reliability | Isolates unreliable tests from the blocking path while keeping them visible for remediation |
| Pipeline Architecture | Job ordering and workflow design | Fails fast, separates fast PR checks from comprehensive validation, and avoids unnecessary waiting |
| Runner Optimization | CI/CD infrastructure | Right-sizes compute resources and uses autoscaling to balance performance and cost |
| Continuous Measurement | Pipeline health | Tracks lead time, deployment frequency, cache hit rate, and test flakiness to identify regressions |
9. Frequently Asked Questions
Q: What is the single most effective way to speed up a slow CI/CD pipeline?
Caching almost always delivers the biggest first win, since it eliminates redundant work like reinstalling dependencies or rebuilding unchanged Docker layers. Caching is the single most impactful optimization for most pipelines, capable of cutting pipeline time by 40 to 60 percent in typical setups. The catch is that a poorly configured cache can actually slow things down, so cache key design deserves real attention rather than a default configuration.
Q: Should every test run on every commit?
No. Running every test on every change feels safe, but it is often the wrong tradeoff once a codebase reaches real scale. Test impact analysis solves this by mapping each test to the code it actually exercises and running only the tests affected by a given change, which can reduce CI runtime by 40 to 70 percent depending on the tooling used, without sacrificing meaningful coverage.
Q: Why do teams keep rerunning flaky tests instead of just fixing them?
Because rerunning feels faster in the moment, even though it quietly costs far more over time. Flaky tests incur a cost of 6 to 8 hours per engineer per week in diagnostics and unnecessary reruns. The better approach is quarantining flaky tests into a separate, non-blocking lane with a clear owner and expiry date, so they get fixed instead of silently tolerated

