1. Local Kubernetes Setup (Minikube)
For many developers, the real challenge with Kubernetes is not understanding the concepts—it is setting up a working environment to apply them. Running Kubernetes locally provides a safe and controlled setup to experiment, test configurations, and understand how components interact without relying on cloud infrastructure.
A local Kubernetes cluster is especially useful for:
- Developing and testing applications before production deployment
- Validating YAML configurations and deployment strategies
- Debugging issues in an isolated environment
- Learning how Kubernetes behaves under different workloads
1.1 What is Minikube and Why Use It?
Minikube enables you to run a single-node Kubernetes cluster locally on your machine, making it easy to get started with hands-on practice. It provides a real cluster-like environment where you can:
- Deploy and manage applications
- Test Kubernetes configurations (YAML files)
- Observe cluster behavior in real time
- Debug issues without incurring cloud costs
It is the most practical way to transition from learning Kubernetes concepts to actually working with them in a real environment.
2. Bootstrapping a Reliable Local Cluster with Minikube
2.1 Environment Setup Workflow
Step 1: Install Container Runtime (Docker)
Kubernetes runs workloads inside containers, so a container runtime is required. Install Docker and ensure it is running.
| sudo apt update sudo apt install -y docker.io sudo systemctl enable docker sudo systemctl start docker |
Verify :
| docker --version docker run hello-world |
Step 2: Install Kubernetes CLI (kubectl)
kubectl is used to interact with the cluster—deploy applications, inspect resources, and debug issues.
| curl -LO "https://dl.k8s.io/release/$(curl -L -s https://dl.k8s.io/release/stable.txt)/bin/linux/amd64/kubectl" sudo install kubectl /usr/local/bin/kubectl kubectl version --client |
Step 3: Install Minikube
Install Minikube, which will create and manage our local Kubernetes cluster.
| curl -LO https://storage.googleapis.com/minikube/releases/latest/minikube-linux-amd64 sudo install minikube-linux-amd64 /usr/local/bin/minikube minikube version |
Step 4: Configure Minikube Driver
Minikube requires a driver to run the cluster. The Docker driver is recommended for simplicity and performance.
Set Docker as default:
| minikube config set driver docker |
Step 5: Start Minikube with Proper Resources
Start the cluster with sufficient CPU, memory, and disk to avoid instability:
| minikube start \ --cpus=4 \ --memory=7168 \ --disk-size=25g \ --driver=docker |
Allocating higher resources ensures smooth execution when running multiple services.
Step 6: Enable Essential Add-ons
This step enables essential Minikube add-ons required for better cluster functionality. The metrics-server collects resource usage data such as CPU and memory, which is needed for features like autoscaling. The dashboard provides a web-based UI to visualize, monitor, and manage cluster resources easily.
| minikube addons enable metrics-server minikube addons enable dashboard |
Step 7: Create Namespace and Deploy Applications Using YAML
Before deploying applications, create a namespace to logically isolate resources:
| kubectl create namespace stress-apps |
At this stage, the cluster is running, but no workloads are deployed yet.
Kubernetes applications are defined using YAML configuration files.
These files describe:
- Deployments (applications)
- Services (network access)
- StatefulSets (databases)
Apply your YAML files:
| kubectl apply -f k8s/01-mariadb.yaml -n stress-apps kubectl apply -f k8s/02-backend.yaml -n stress-apps |
Step 8 : Verify Cluster Status
Ensure the cluster is running correctly:
| kubectl get nodes kubectl get pods -n stress-apps |
Expected:
- Node should be in Ready state
- System pods should be running
For example see this output where namespace is stress-apps :
user@user-VivoBook-ASUSLaptop:~$ kubectl get pods -n stress-apps
|
Step 9: Access minikube dashboard
| minikube dashboard |
Output will be like :
user@user-VivoBook-ASUSLaptop::~$ minikube dashboard Verifying proxy health ... |
It will open a new window on browser as :
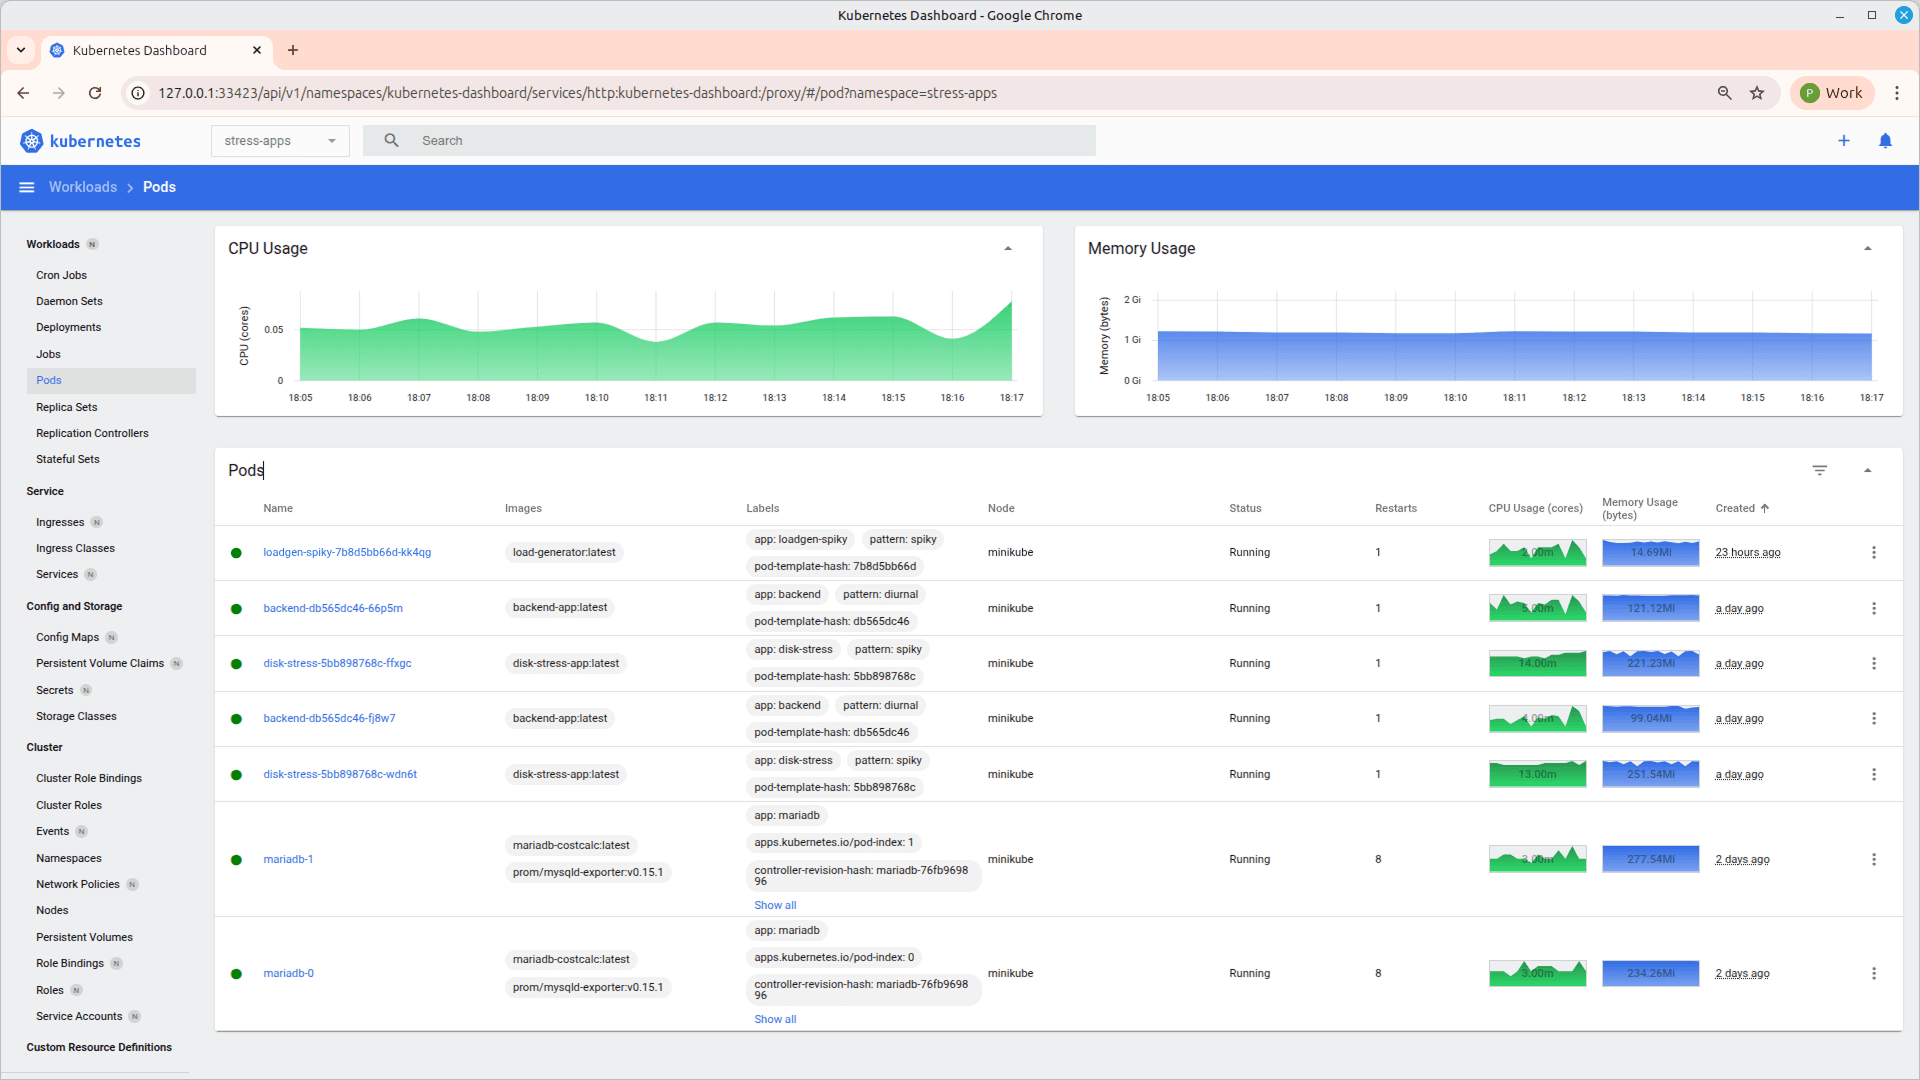 Using the dashboard, you can inspect running Pods and Deployments to understand how applications are structured and managed within the cluster. It provides a visual view of resource usage such as CPU and memory, helping identify performance patterns. You can also access logs and events for each resource, which is useful for troubleshooting issues. Overall, it simplifies debugging by offering an intuitive interface to analyze cluster behavior.
Step 10: Install Prometheus and Grafana Using Helm for monitoring (if required)
Once the applications are deployed, monitoring can be set up using Helm.
Add Helm Repository
| helm repo add prometheus-community https://prometheus-community.github.io/helm-charts |
| helm repo update |
Install Prometheus + Grafana Stack
| helm install monitoring prometheus-community/kube-prometheus-stack \ --namespace monitoring --create-namespace \ --set grafana.adminPassword=admin123 \ --set prometheus.prometheusSpec.scrapeInterval=15s |
This installs:
- Prometheus → collects and stores metrics
- Grafana → visualizes metrics through dashboards
Access Grafana
| kubectl port-forward -n monitoring svc/monitoring-grafana 3001:80 |
Username: admin
Password: admin123
Access Prometheus
| kubectl port-forward -n monitoring svc/monitoring-kube-prometheus-prometheus 9090:9090 |
3. Building & Running Services Inside the Cluster
In the previous section, the cluster was created using Minikube and the required tools were installed. The next step is to understand how an application moves from source code to a running workload inside the cluster.
Kubernetes does not run applications directly from source code. It runs container images, and those images are orchestrated using declarative configurations. This section explains the end-to-end flow.
3.1 How the Execution Flow Works
The process begins with an application (for example, a backend service or database). This application must first be containerized using Docker. A Dockerfile defines how the application is packaged, including its dependencies and startup command. From this, a Docker image is created.
However, building the image locally is not sufficient. Minikube runs its own internal Docker environment, which is separate from the host machine. For Kubernetes to use the image, it must exist inside Minikube’s Docker daemon. This is achieved by pointing the terminal to Minikube’s Docker environment and building the image there. Once this is done, the image becomes available to the cluster.
To make the image available inside Minikube, connect your terminal to Minikube’s Docker environment:
Option 1: Load existing local image into Minikube
| minikube image load <your-image-name> |
Option 2: Build image directly inside Minikube Docker
| eval $(minikube docker-env) docker build -t <your-image-name> . |
At this stage, the application is packaged and accessible, but Kubernetes still does not know how to run it. This is where YAML configuration files come into play.
3.2 YAML configuration files setup
These files define the desired state of the system—what should run, how many instances should exist, and which image should be used. A typical YAML configuration includes:
- A Deployment, which manages the lifecycle and scaling of application pods
- A StatefulSet, used for stateful components like databases
- A Service, which exposes the application within or outside the cluster
| apiVersion: apps/v1 kind: Deployment metadata: name: backend spec: replicas: 2 selector: matchLabels: app: backend template: metadata: labels: app: backend spec: containers: - name: backend image: backend-app:latest --- apiVersion: v1 kind: Service metadata: name: backend-svc spec: selector: app: backend ports: - port: 80 targetPort: 8080 |
These YAML files are stored locally and applied to the cluster using kubectl as step 7 . These files act as the source of truth for Kubernetes, defining the desired state of the system. When a YAML file is applied, it is sent to the Kubernetes API server, which records it as the desired state.
Kubernetes controllers then take over. The Deployment controller creates a ReplicaSet, which ensures that the required number of Pods are running. The scheduler assigns these Pods to the available node in Minikube. The container runtime then starts containers using the specified image.
If the image is available inside Minikube, the container starts successfully and the Pod transitions to a Running state. If not, errors such as ImagePullBackOff occur.
3.3 End-to-End Flow Summary
The complete flow can be understood as:
- Application code is packaged into a Docker image
- Image is built inside Minikube’s Docker environment
- YAML files define how the application should run
- kubectl applies these configurations to the cluster
- Kubernetes creates and manages Pods based on the defined state
- Containers start using the specified image, and workloads become active
3.4 Key Understanding
- Docker defines and builds the application image
- Minikube provides the execution environment
- YAML defines the desired state
- kubectl communicates with the cluster
- Kubernetes ensures that the application runs as defined
4. Autoscaling in Kubernetes
4.1 Horizontal Pod Autoscaler (HPA)
Horizontal Pod Autoscaler (HPA) automatically adjusts the number of running pods based on resource usage.It helps applications handle traffic spikes without manual intervention.
HPA improves resource utilization by scaling down during low load.
It is essential for building reliable and cost-efficient systems.
| apiVersion: autoscaling/v2 kind: HorizontalPodAutoscaler metadata: name: backend-hpa spec: scaleTargetRef: apiVersion: apps/v1 kind: Deployment name: backend minReplicas: 2 maxReplicas: 10 metrics: - type: Resource resource: name: cpu target: type: Utilization averageUtilization: 70 |
4.1 How Autoscaling Works
HPA continuously monitors CPU utilization of the pods using metrics collected by the cluster. The averageUtilization: 70 means Kubernetes will try to maintain CPU usage around 70% across all pods.
If CPU usage goes above 70%, HPA increases the number of pods to distribute the load. If CPU usage drops below this threshold, it reduces the number of pods to save resources.
The minReplicas defines the minimum number of pods that will always be running, even during low traffic. The maxReplicas defines the upper limit to which the application can scale during high load. This ensures controlled and predictable autoscaling behavior.
5. Cluster Performance Monitoring (Prometheus & Grafana)
Once the applications are deployed and autoscaling is configured, it becomes important to continuously monitor how the cluster and workloads are behaving. Monitoring helps in understanding resource utilization, identifying bottlenecks, and validating scaling decisions.
In this setup, Prometheus is used to collect metrics, and Grafana is used to visualize them through dashboards.
CPU and memory utilization can be monitored at both pod and node level using Grafana dashboards such as “Kubernetes / Compute Resources / Namespace (Pods)” and “Pod” view. These dashboards provide a clear view of how each workload is consuming resources over time. Kubernetes also exposes detailed container-level metrics through cAdvisor, including CPU usage, memory consumption, disk I/O, and network activity, which are collected by Prometheus and visualized in Grafana.
To analyze these metrics, queries can be used in Grafana panels or Prometheus UI, such as
| rate(container_cpu_usage_seconds_total{namespace="stress-apps", container!=""}[2m]) |
| container_memory_working_set_bytes{namespace="stress-apps", container!=""} |
for CPU usage and memory usage respectively. We are accessing Grafana at http://localhost:3001, navigate to dashboards, and select the appropriate view to observe real-time utilization. These insights help identify performance issues, validate autoscaling behavior, and ensure efficient resource usage across the cluster.
6. Things to Remember
- Kubernetes does not run applications directly from source code—it runs container images.
- Always ensure images are available inside the Minikube environment before deploying.
- YAML files define the desired state, and Kubernetes continuously works to maintain that state.
- Namespaces help organize and isolate resources within the cluster.
- kubectl is the primary tool to interact with and manage cluster resources.
- Autoscaling using HPA is based on real-time metrics and helps handle dynamic workloads efficiently.
- Monitoring using Prometheus and Grafana is essential to understand system behavior and performance.
- Always verify deployments using kubectl get pods and logs before proceeding further.