
"Slow" in Kubernetes is not one problem, it's a symptom that can trace back to several unrelated layers of the system. Treating it as a single issue, usually by restarting pods or adding nodes first, is why teams often burn hours before anything measurably improves. The more reliable approach is to narrow down which layer is actually degraded: control plane, scheduling, node resources, network, or storage. Each layer has a small set of signals worth checking, and checking them in the wrong order wastes time without ruling anything out.
What follows is a practical triage sequence based on where these problems most commonly originate, not an exhaustive list of every possible cause.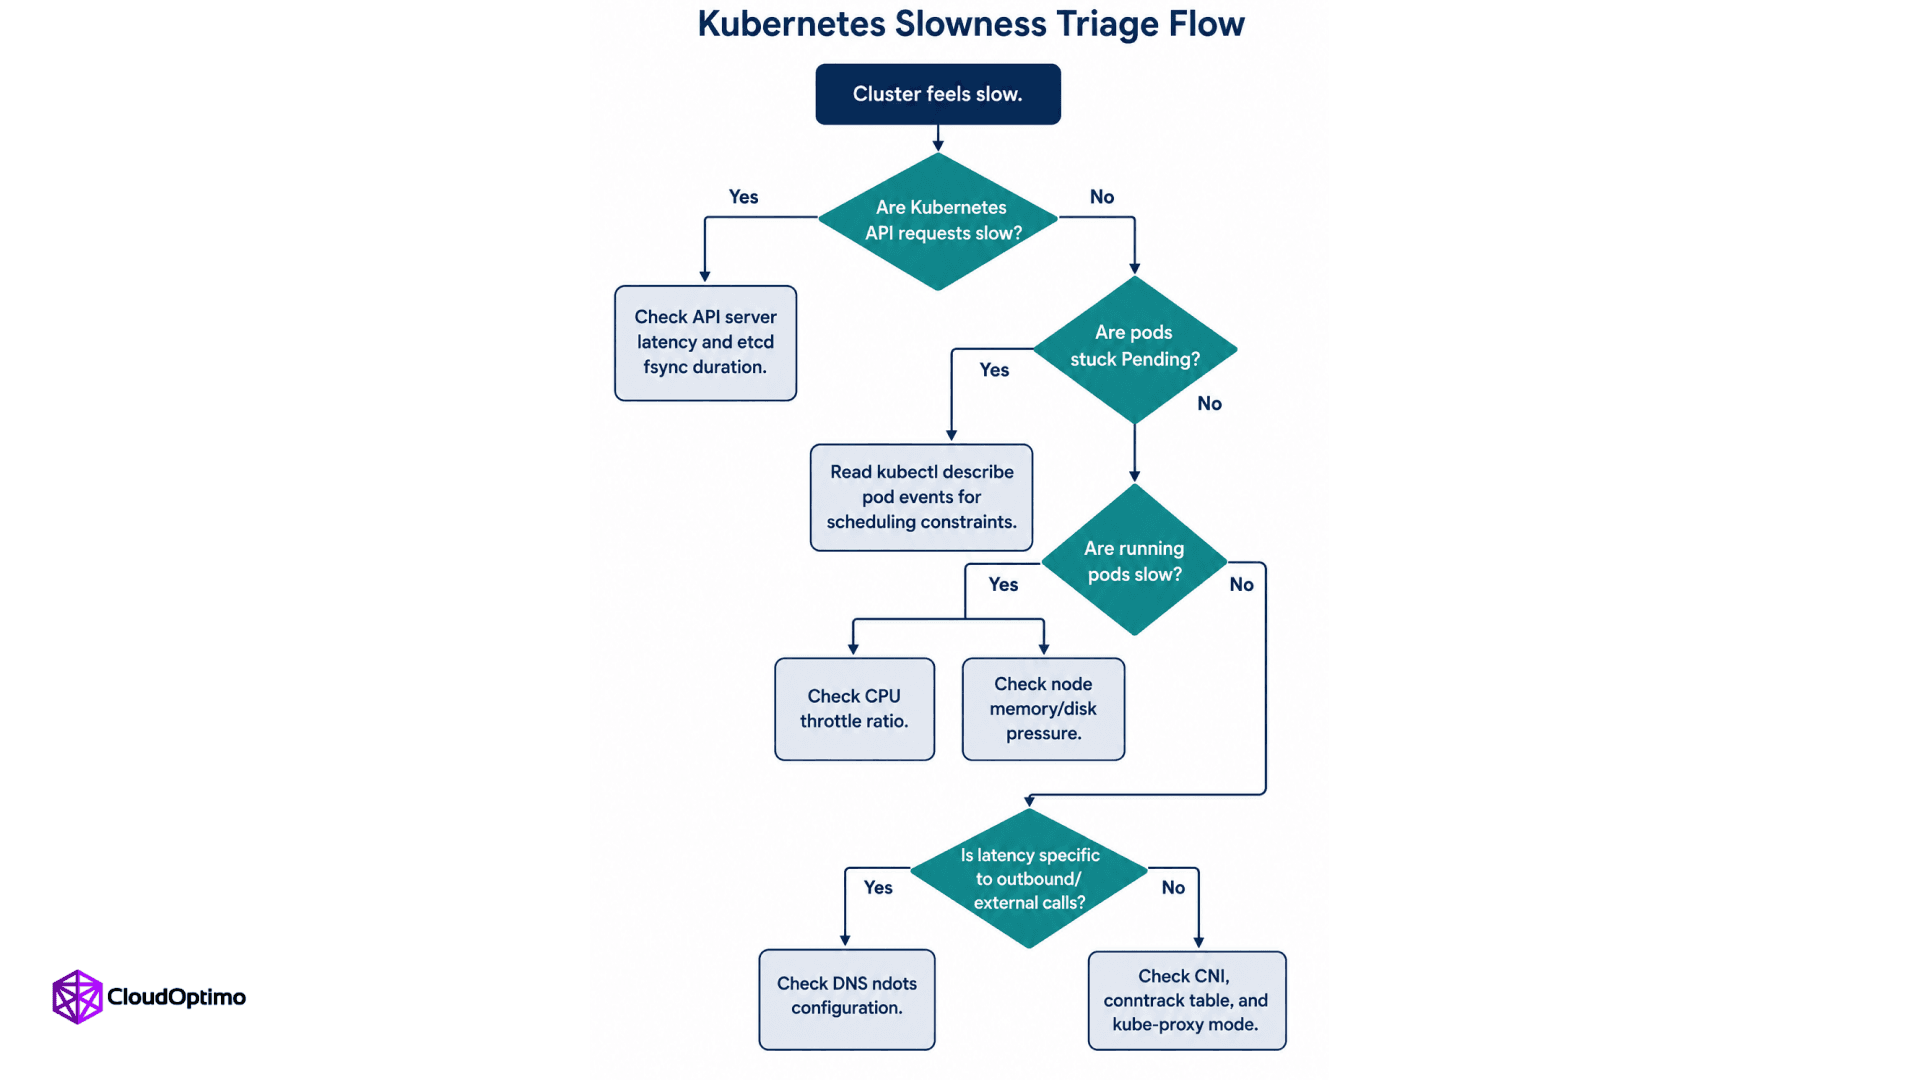
Start with the control plane, not the workload
If kubectl get pods itself feels sluggish, start by investigating the API server and its dependencies rather than the application workload. This is worth ruling out early because it changes where you look next.
Check API server request latency by verb and resource using the stable apiserver_request_duration_seconds histogram:
| histogram_quantile(0.99, sum(rate(apiserver_request_duration_seconds_bucket[5m])) by (le, verb, resource) ) |
If a single verb/resource pair dominates, that narrows the search fast. If LIST requests occur unusually frequently or dominate the request volume, a controller may be polling the API server too aggressively, for example by repeatedly listing all objects of a type across every namespace on a short interval instead of relying on an informer with a local cache. WATCH requests are normal for controllers using informers, so treat high WATCH volume separately and confirm the pattern against apiserver_request_total broken down by verb and resource before concluding that a controller is the cause.
If API writes are slow and API-server-side processing doesn't explain the latency, check etcd. etcd is highly sensitive to storage latency because Kubernetes object writes are replicated through Raft and durably persisted to the etcd WAL. etcd batches multiple requests together for throughput, but slow disk synchronization can still increase commit latency and affect cluster responsiveness. The relevant metric is etcd_disk_wal_fsync_duration_seconds. etcd's own documentation recommends keeping p99 fsync latency under roughly 10ms for stable operation; sustained latency well above that is a strong signal to investigate storage performance, though the point at which it becomes user-visible depends on write volume and cluster size. This is also why etcd typically runs on dedicated local SSD or NVMe storage rather than shared network-attached disks.
Frequent etcd leader elections (etcd_server_leader_changes_seen_total increasing) are commonly triggered by slow disk fsync latency, but etcd's own documentation also names CPU starvation on the etcd host as a common cause, alongside network latency between members. Check CPU utilization on the control plane nodes alongside disk and network metrics rather than assuming storage is the only possible explanation.
Pods stuck Pending is a scheduling problem, not general slowness
If new pods sit in Pending for an extended time, that's a distinct failure mode from "everything runs slowly." Run:
| bash kubectl describe pod <pod-name> |
and read the Events section. The scheduler records its own reasoning here: insufficient CPU or memory on any node, an unsatisfied node affinity or topology spread constraint, or a taint without a matching toleration. This is usually deterministic and doesn't require guessing
This is a separate problem from the scheduler itself being slow to make decisions, which is rare but does happen in clusters with a very large number of pending pods or expensive filtering/scoring plugins. kube-scheduler exposes scheduler_pending_pods (broken down by queue: active, backoff, unschedulable, gated) and scheduler_scheduling_attempt_duration_seconds. A large and growing unschedulable or backoff queue alongside rising attempt duration points at scheduler throughput itself, not just node capacity.
A related but distinct cause is namespace-level ResourceQuota. Unlike a scheduling constraint, an exhausted quota doesn't leave a pod sitting in Pending. The API server rejects the creation request outright at admission time with a 403 Forbidden: exceeded quota error, so no pod object is ever created for kubectl describe pod to show you. For pods managed by a Deployment or ReplicaSet, this shows up as the controller repeatedly failing to create new Pods, which looks like a stalled rollout rather than classic scheduling delay. Check with kubectl describe resourcequota -n <namespace> and the Deployment's events for FailedCreate.
CPU throttling: frequently invisible on standard dashboards
This deserves specific attention because it commonly goes unnoticed. When you set resources.limits.cpu on a container, Kubernetes enforces CPU limits through CPU bandwidth controls rather than as a smooth instantaneous cap. On Linux, it's enforced through the kernel's CPU bandwidth controls: a CPU bandwidth period, typically 100ms, and a quota representing the CPU time allowed within that period. On cgroup v1 this is represented by the cpu.cfs_period_us and cpu.cfs_quota_us files; cgroup v2 exposes the same period and quota values together through the cpu.max file. The underlying enforcement is the same either way: if a container's threads consume their quota early in the period, the kernel suspends every thread in that cgroup until the next period starts, regardless of how little CPU the container used on average.
The practical effect: a pod can show low average CPU utilization on a dashboard while being throttled repeatedly, because dashboards typically report averages over seconds while the kernel enforces a fixed, much shorter window. This matters most for multi-threaded or latency-sensitive services, where a brief burst during request parsing, garbage collection, or a TLS handshake can trigger a suspend that adds measurable tail latency.
You can check the throttle ratio from cAdvisor container metrics:
| rate(container_cpu_cfs_throttled_periods_total[5m]) / rate(container_cpu_cfs_periods_total[5m]) |
There is no official Kubernetes-defined threshold for what counts as excessive throttling; teams commonly use a ratio in the 20 to 25% range as a starting point for investigation, and treat anything approaching 50% as a strong signal, but these are practical heuristics rather than fixed standards, and the right threshold depends on how latency-sensitive the workload is. A high throttle ratio also does not automatically mean throttling is the cause of observed latency; it means it's a plausible contributor worth correlating against actual request latency before you act on it.
Fixes are workload-dependent: raise the CPU limit, remove the limit entirely and rely on CPU requests with fair-share scheduling for less latency-sensitive workloads, or reduce thread pool concurrency so bursts fit inside a single period. Removing limits trades throttling risk for noisy-neighbor risk on shared nodes, so it's a trade-off rather than a universal fix.
Memory and disk pressure
Kubelet defines default hard eviction thresholds on Linux nodes: memory.available < 100Mi, nodefs.available < 10%, imagefs.available < 15%, and inode-based thresholds around 5% for both nodefs and imagefs. When a hard threshold is crossed, kubelet evicts pods immediately without a graceful termination period. If pods are disappearing and restarting under load rather than simply running slowly, check node conditions:
| bash kubectl describe node <node-name> | grep -A5 Conditions |
MemoryPressure or DiskPressure set to True explains eviction directly. These are the documented upstream Linux defaults, but managed Kubernetes offerings and custom kubelet configurations can and do override them, so confirm the actual evictionHard values on the node before assuming defaults apply in your environment.
It's also worth distinguishing eviction from an OOM kill. An OOM kill happens per-container when it exceeds its own memory limit, visible as OOMKilled in kubectl describe pod. Eviction happens at the node level when the node as a whole is short on a resource, and it can affect pods that were individually within their limits.
DNS latency from ndots
Unexplained latency specific to outbound calls to external services is a common and identifiable pattern. Pods using the default cluster DNS configuration commonly receive ndots:5 in /etc/resolv.conf, along with cluster search domains. With ndots:5, a name with fewer than five dots is generally treated as relative first, so the resolver may try the configured search domains before attempting the name as provided. For an external name such as api.stripe.com, that can result in several additional DNS queries, for example against api.stripe.com.<namespace>.svc.cluster.local, api.stripe.com.svc.cluster.local, and api.stripe.com.cluster.local, before the external name resolves as given. The exact sequence and how failures within it are handled depend on the resolver library in use, not just the ndots setting itself.
Resolver behavior can differ between musl and glibc, so test DNS behavior with the actual base image.
Check a pod's resolver configuration directly:
| bash kubectl exec <pod> -- cat /etc/resolv.conf |
For workloads that mostly call external APIs, setting dnsConfig.options with ndots: "2" in the pod spec, or using fully qualified domain names with a trailing dot, can reduce unnecessary search-domain lookups. Because this changes resolver behavior, test it against the workload's actual internal naming patterns before applying it broadly. If CoreDNS's Prometheus metrics are enabled, check response and error behavior, such as response codes and cache hit/miss rates, along with CoreDNS's own CPU and memory usage. The exact metric names and what's exposed depend on the CoreDNS version and which plugins are enabled in the Corefile; as an example, recent CoreDNS versions typically expose coredns_dns_responses_total (labeled by rcode, so you can watch for a rising share of SERVFAIL), but don't assume a metric name will be present without checking /metrics on your CoreDNS deployment first. An undersized CoreDNS deployment under load can produce intermittent DNS latency and, when severe, resolution failures.
Networking and the CNI layer
If direct pod-to-pod latency is elevated regardless of which service is involved, look at the CNI dataplane, node networking, packet loss, MTU configuration, and cross-availability-zone traffic before investigating individual applications. For traffic that passes through Kubernetes Services, also check the kube-proxy layer and conntrack table pressure on nodes with high connection churn (nf_conntrack_count approaching nf_conntrack_max). When kube-proxy runs in iptables mode, large numbers of Services and endpoints can also increase rule-management overhead. Cross-availability-zone traffic adds real network latency and, on most cloud providers, extra data transfer cost. Switching kube-proxy to nftables mode, or adopting a CNI with eBPF-based service routing, can reduce service-proxy overhead in clusters with very large Service counts or high connection churn, though the benefit depends on the Kubernetes version, networking implementation, Service count, and traffic patterns rather than cluster size alone. IPVS was historically used as an alternative kube-proxy mode, but it is deprecated in Kubernetes 1.35 and should not be presented as the preferred option for new deployments.
MTU mismatches are particularly worth checking when latency or packet loss appears only for larger packets, especially in overlay networks, because an incorrect pod or tunnel MTU can cause fragmentation, retransmissions, or dropped packets that are difficult to identify from application-level metrics alone.
Persistent storage latency
Node disk pressure, covered above, is about the node's own filesystem: kubelet's local storage for images, container writable layers, and logs. It's a different problem from an application being slow because the persistent volume it reads and writes is slow. A node can show healthy DiskPressure: False while a specific pod's mounted PVC is saturated or degraded.
Start with the object status rather than guessing at performance: kubectl get pvc -n <namespace> and kubectl describe pvc <name> -n <namespace> show whether the claim is Bound and surface provisioning or resize events. kubectl get events -n <namespace> --field-selector involvedObject.name=<pod-name> surfaces FailedMount or FailedAttachVolume events, which point at the CSI driver or the underlying cloud volume rather than the application. kubectl get volumeattachment shows whether a volume is still attached to a different node, a common cause of mount delays after a pod reschedules.
Kubelet exposes kubelet_volume_stats_used_bytes and kubelet_volume_stats_capacity_bytes per PVC, useful for catching a volume that's nearly full, which degrades performance on some storage backends before it causes outright write failures. These metrics report capacity, not I/O latency, so they won't show a slow disk directly. To confirm actual read/write latency or IOPS and throughput saturation, you generally need the cloud provider's block storage metrics or the CSI driver's own metrics, since Kubernetes doesn't instrument per-volume I/O latency itself. Provisioned-IOPS and baseline-throughput ceilings on cloud block storage are a common, easy-to-miss cause of latency under sustained write load, and confirming it usually requires checking the storage backend directly.
Autoscaling lag
Sometimes "slow" simply reflects capacity that hasn't caught up yet. The Horizontal Pod Autoscaler evaluates metrics on a control loop with a default interval of 15 seconds (--horizontal-pod-autoscaler-sync-period on kube-controller-manager), while scaling policies and stabilization behavior can limit how quickly replica counts change. Cluster Autoscaler adds node provisioning time on top of that, which varies by cloud provider, instance type, and image pull time. If this delay is the actual bottleneck, the fix is usually pre-scaling for known traffic patterns or scheduled scaling, not troubleshooting the cluster as if something is broken.
A short diagnostic order
- Are Kubernetes API requests slow? Check API server request latency and etcd fsync duration first.
- Are pods stuck Pending, or is a Deployment failing to create new pods? Read scheduler events and check for ResourceQuota rejections separately.
- Are running pods slow but scheduled normally? Check the CPU throttle ratio, then node memory and disk pressure.
- Is a specific stateful workload slow while the node looks healthy? Check PVC status, volume attachment events, and storage backend metrics.
- Is latency specific to outbound calls? Check ndots behavior and CoreDNS load.
- Is latency uniform across services regardless of workload? Check conntrack and kube-proxy mode.
- Did slowness follow a traffic spike? Check HPA and Cluster Autoscaler timing before assuming a capacity or configuration problem.
Many slowness incidents can be narrowed down quickly at step 1 or step 3: control-plane issues can affect cluster-wide operations, while CPU throttling can explain latency in individual workloads even when average CPU utilization looks normal. Jumping straight to adding nodes or raising resource requests without confirming which layer is actually degraded can mask the underlying cause, which may reappear later under different or more demanding conditions.
Frequently Asked Questions (FAQs)
Q1: Why does my Kubernetes cluster feel slow even though nodes show low average CPU usage?
Average CPU usage is measured over seconds, while CPU limits are enforced by the kernel's CPU bandwidth controls using typically 100ms periods (CFS quota/period on cgroup v1, the cpu.max interface on cgroup v2). A container can exhaust its quota early in a period and get throttled repeatedly while its average usage looks low on a dashboard. Check the throttle ratio directly rather than ruling this out from average utilization alone.
Q2: What's the difference between a pod being evicted and a pod being OOMKilled?
An OOM kill happens when a single container exceeds its own memory limit and the kernel terminates that process. Eviction happens at the node level, triggered by kubelet when overall node memory or disk availability crosses a configured threshold, and it can affect pods that were within their individual resource limits.
Q3: Does lowering ndots to 2 break internal service discovery?
For most clusters, no, since typical internal service names are still matched by the search domains before the external fallback is tried. It mainly reduces how many search-domain attempts happen before an external FQDN resolves. Test it against your actual naming patterns first, and apply it per workload through dnsConfig rather than cluster-wide.

